
What's new in PyNGL and PyNIO
PyNGL 1.6.1 | PyNIO 1.5.4 | PyNGL 1.6.0 | PyNIO 1.5.2 | PyNIO 1.5.1 | PyNGL 1.5.0 | PyNIO 1.5.0 | PyNIO 1.4.3 | PyNIO 1.4.2 | PyNIO 1.5.0-beta | PyNIO 1.4.1 | PyNGL 1.4.0 | PyNGL 1.3.1 | PyNIO 1.4.0 | PyNIO 1.3.0b5 | PyNGL 1.3.0b4 | 1.3.0b1 | 1.2.0 | 1.1.0 | 1.0.0 | 0.1.1b8 | 0.1.1b7 | 0.1.1b6 | 0.1.1b5 | 0.1.1b4 | 0.1.1b3 | 0.1.1b1 | 0.1.0b1PyNGL Version 1.6.1 - November 9, 2018
- Minor changes to PyNGL examples to work with Python 3.
- The Apache 2.0 License has been adopted for PyNGL.
PyNIO Version 1.5.4 - November 9, 2018
- Fix the Nio.path data file entry so it works correctly with pip.
- The Apache 2.0 License has been adopted for PyNIO.
PyNGL Version 1.6.0 - August 21, 2018
This is the release that is supported under Python 3.x.The PyNGL examples have been converted to work under both Python 2.x and 3.x, but there may still be some hiccups. If you do run across an issue, please report it on the GitHub repo.
PyNIO Version 1.5.2 - August 17, 2018
Fixed a bug in which the output arrays were marked as read-only.PyNIO Version 1.5.1 - August 1, 2018
This is the first official release of PyNIO that is supported under Python 3.x.PyNGL Version 1.5.0 - September 26, 2017
This is the first official release of PyNGL since NCL was overhauled in 2012 to update the internal color display model. This release was previously available as a beta version.PyNGL V1.5.0 includes support for:
- 32-bit color (RGBA color, transparency)
- using multiple color maps in one frame
- the use of named colors ("yellow") without first having to add them to the color map
- improved PNG output
- SVG as graphical output
Many examples have been added since the release of PyNGL 1.4.0. Some of them showcase improved or new features added in PyNIO 1.5.0 which was also released in September 2015.
Examples showcasing new graphical features
- newcolor1.py - -
the use of the cnFillPalette
resource, which allows you to associate a color table directly to a
contour plot.
- newcolor2.py - -
the use of the txFontOpacityF resource,
which allows you to control the opacity of text on a plot.
- newcolor3.py - -
the use of the vcGlyphOpacityF
resource, which allows you to control the opacity of vectors on a
plot.
- newcolor4.py - -
using cnFillPalette, which allows
you to have three sets of contours on the same frame, each with a
different color map.
- newcolor6.py -
the use of the cnFillOpacityF
resource, which allows you to control the opacity of contours on a
plot.
- NUG_unstructured_ICON_triangles_PyNGL.py - the use of gsColors for drawing lots of filled polygons quickly.
Examples showcasing new capabilities in PyNIO 1.5.0
PyNGL examples that are part of the NCL User Guide
- NUG_curvilinear_contour_PyNGL.py
- NUG_rectilinear_contour_PyNGL.py
- NUG_rectilinear_slice_PyNGL.py
- NUG_rectilinear_vector_PyNGL.py
- NUG_unstructured_ICON_triangles_PyNGL.py
- NUG_unstructured_contour_cellfill_PyNGL.py
- NUG_xy_plot_simple_PyNGL.py
Plotting unstructured data
Plotting WRF-ARW data
Important note: these examples use deprecated WRF computational and graphical routines that were internally added to PyNGL, but not documented. WRF users should use the full-fledged wrf-python python package for WRF-ARW diagnostics and interpolation routines.
We will update these PyNGL examples to use wrf-python in the next release of PyNGL.
Other miscellaneous examples
PyNIO Version 1.5.0 - September 21, 2017
This version has actually been out awhile as 1.5.0-beta. We are finishing up porting PyNIO to Python 3.x, so we decided to do an official 1.5.0 release before we release a version for Python 3.x.PyNIO V1.5.0 includes support for:
- NetCDF4/HDF5 groups and strings
- NetCDF4/HDF5 user-defined data types including variable-length array, compound, enumerated and opaque. The interfaces for these types are still under development and subject to change.
- Substantial improvements to the GRIB1 and GRIB2 readers as well as minor fixes for other formats
- CDF5 large variable data
- New read-only attributes "name", "path", and "size"
PyNIO Version 1.4.3 - December 30, 2015
Mostly bug fixes for 1.4.2.PyNIO Version 1.4.2 - December 15, 2015
An internal bug fix release. PyNIO put under "conda".conda install -c ncar pynio
PyNIO Version 1.5.0-beta - April 4, 2015
This version was a special release for the NCAR SEA conference in April 2015. It has support for new features like groups and compound data in NetCDF4 and HDF5 files.PyNIO Version 1.4.1 - July 28, 2011
- Added a new NioFile Boolean method called 'unlimited' that takes a
dimension name as its only argument and returns True if the dimension
is an unlimited record dimension and False otherwise.
- Added support for unsigned integer types and large 64 bit integers
both signed and unsigned. The byte type is now signed and the new
ubyte type is unsigned. Users are cautioned to be on the lookout for
variable type changes from signed to unsigned, or the reverse in the
case of the byte type. This is a possible source of minor incompatibility
between older versions of PyNIO and the latest version.
- PyNIO can now handle files that have variables or single
dimensions that are larger than 2^31.
- Fixed a bug that caused the an import of Nio to fail if the numpy
version release number had non-numeric characters such as 'rc3'.
- Fixed a serious memory issue that was caused by PyNIO
inadvertently 'stealing' memory when attributes with numerical values
were set with the file opened in write mode. This was causing a Python
crash in the case of a user script that created a series of attributes
that were to be set with the same values in multiple files.
- Fixed a problem with the global and variable 'attributes'
dictionary not being updated immediately. Previously the file needed
to be closed and reopened for changes to the 'attributes' dictionaries
to take effect.
- Similarly, changes to the size of the unlimited dimension
previously did not show up until the file was closed and then
reopened. Now changes to the unlimited dimension size are immediately
visible.
- Extended coordinate selection has been modified to no longer
return an error if a coordinate variable for every dimension is not
included in the selection. Now when a coordinate is not included, all
elements of the corresponding dimension are returned.
- A bug reading shapefiles on 64-bit Linux systems was fixed. The
global shapefile attributes layer_name and geometry_type no longer
are set incorrectly to null values.
- PyNIO 1.4.1 includes very limited support for reading HDF5
files. Only simple numeric variables can be read from and HDF5
file. Groups and non-atomic datatypes are not yet supported. Note,
however, that PyNIO does have full (read-only) support for HDFEOS5
files.
- For PyNIO users building from source code, a bug was fixed that
caused an immediate error exit if the code was compiled without
support for GRIB2. Also all formats except NetCDF are now optional;
If there is no need for HDF4 it no longer needs to be built into the module.
- A new module-level dictionary attribute called "__formats__" has
been added. The optional format names are keys and each value is 1 or
0 depending on whether the format is has been included in the
particular instance of PyNIO during the build process. If all formats
are included it will have the following key/value pairs:
{'hdfeos5':
1, 'netcdf4': 1, 'hdf4': 1, 'hdf5': 1, 'shapefile': 1, 'grib2': 1,
'hdfeos': 1, 'opendap': 1}
. Note that in the case of 'netcdf4' the value indicates whether PyNIO is built with NetCDF4 classic model enabled. - GRIB reading improvements:
- Fixed a bug involving the pre-defined GRIB1 grid 242. It had the wrong Dx and Dy values.
- Fixed a bug involving Canadian Meteorology Centre data both in GRIB1 and GRIB2 formats where global grids have the starting and ending longitude set to identical values. Now the longitude coordinates are correctly calculated to span a full 360 degrees.
- Improved the handling of GRIB1 tables from center 59, formerly known as the NOAA Forecast Systems Lab, and now called the Global Systems Division of the Earth System Research Laboratory. Standard NCEP tables are now used where possible for otherwise unknown table versions from center 59.
- Fixed a problem with user-defined GRIB1 parameter tables that contain an entry for parameter 0, which is never used as a parameter number but was confusing the table-reading code when it appeared.
- Fixed a problem with the GRIB2 parameter_discipline_and_category variable attribute that caused it to contain incorrect information in some cases.
- Added support for GRIB2 template 4.31, used for satellite products particularly in Europe.
- Fixed a problem with calculating latitude values for GRIB1 and GRIB2 Mercator grids.
PyNGL Version 1.4.0 - July 28, 2011
This version of PyNGL doesn't have a lot of new functionality. It was given a higher version number because it was significantly overhauled internally so it can be compiled with NCL version 6.0.0. The source code for this release cannot be linked against NCL versions 5.2.x or earlier.
- Ngl.dim_gbits - a new
function that unpacks bit chunks from the rightmost dimension of the
input array.
- Ngl.gc_inout - a new
function that determines if a specified point is inside or outside of
a spherical polygon. This is handy for masking data given a particular
lat/lon polygon.
- Added a new example
"hdf1.py"
(image) to the
PyNGL gallery showing how to
use Ngl.dim_gbits to extract bit
data for a cloud mask variable.
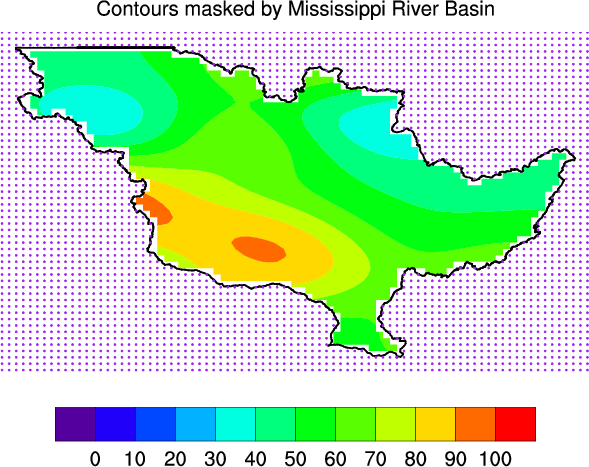
- Added a new example
"shapefile3.py"
(image) to the
PyNGL gallery showing how to
use Ngl.gc_inout to mask data given
a lat/lon polygon.
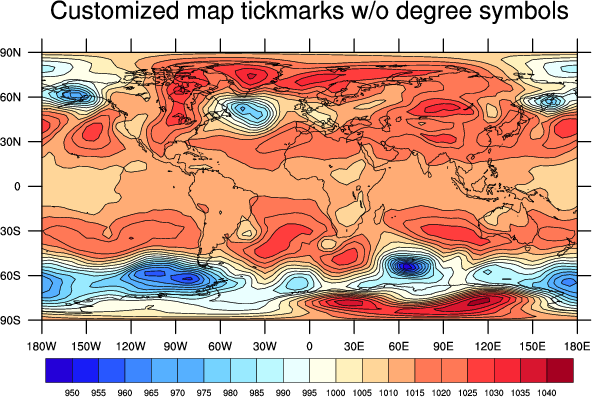
- Added a new example
"tickmark2.py" to the
(image) to the
PyNGL gallery showing how to
remove the degree symbol from map tickmark labels.
- Ngl.labelbar_ndc - Fixed a bug
that caused this function to seg fault.
- cnLabelBarEndStyle - fixed a bug that caused labelbar labels to be dropped randomly.
PyNGL Version 1.3.1 - August 22, 2010
New functions- Ngl.blank_plot - Creates a blank
plot.
- Ngl.get_bounding_box - Retrieves
the NDC bounding box values for a given graphical object.
- Ngl.nice_cntr_levels - Given min/max values and the maximum number of steps desired, calculates an array of "nice" equally-spaced values through the data domain.
New resources
- Added new resources that allow you to fill between curves
in an XY plot:
nglXYFillColors
nglAboveXYFillColors/nglBelowXYFillColors
nglXYLeftFillColors/nglRightXYFillColors
New examples
- New shapefile1/shapefile2 - examples showing how to
read and plot data from shapefiles.
- New tickmark1 - example showing how to
create a "blank" plot to use for customizing tickmark labels.
- New viewport1 - example showing the different
between a plot's viewport and its bounding box
- New fillxy1/fillxy2 - examples showing how to
fill between curves in an XY plot.
Bugs fixed
- Ngl.add_polyline - fixed a bug where this function wasn't handling missing values properly.
PyNIO Version 1.4.0 - August 16, 2010
- PyNIO source build procedure updated to remove installation of NCL as a prequisite. See
How to build PyNIO from source code for details.
- Optional read-only support added for HDF-EOS5 files. GRID, SWATH, and ZA
data groups are supported. Also, limited metadata is provided by the interface for POINT metadata groups.
- Optional read-only support also added for OGR - Open Geospatial Consortium's Simple Feature formats including ESRI shapefiles, and MapInfo, GMT, and TIGER data.
- Fixed a problem that resulted in the generation of incorrect forecast times for statistical-process variables contained in GRIB2 files from
NDFD (National Digital Forecast Database).
- Fixed a problem with attempts to write empty strings to HDF attributes.
- Fixed a problem that caused the assign_value method to fail when used to write to a variable with an unlimited dimension.
- Fixed a problem that caused NumPy arrays returned by PyNIO not to be writeable by the user. The WRITEABLE flag was inadvertently being set to False.
PyNIO Version 1.3.0b5 - April 1, 2010
- Updated code to build under Python 2.6.
- Added OPeNDAP capabilities for reading NetCDF files. You can now
read a NetCDF file that is stored on an OPeNDAP server:
import Nio

fname = "http://test.opendap.org/opendap/data/nc/123.nc"
f = Nio.open_file(fname)
variables = f.variables.keys()

print f
print "variables",variables
- Added support for unsigned int and int64 types.
- Fixed several memory leaks.
- Fixed a bug with assigning to file variables with single element
dimensions.
- Fixed a bug involving assigning to file variables with an
unlimited dimension using non-explicit slice start and/or stop values
([:],[3:], etc).
- Fixed a problem that caused the '~' character and environment variables used in file paths not to be expanded properly when a file was opened for writing.
- Updates and changes to GRIB2 reader:
-
BACKWARDS INCOMPATIBILITY ALERT
- Go to the Earth System Grid web site and download the full source code for NCL version 5.2.1.
- In a suitable location in your filesystem execute these commands in a terminal window:
- gunzip -c ncl_ncarg_src-5.2.1.tar.gz | tar -xvf -
- cp -r ncl_ncarg-5.2.1/ni/src/db/grib2_codetables.previous </directory/of/choice/>
- export NIO_GRIB2_CODETABLES=</directory/of/choice/>grib2_codetables.previous (bash, ksh, sh)
or
setenv NIO_GRIB2_CODETABLES </directory/of/choice/>grib2_codetables.previous (csh, tcsh)
- Added partial support for GRIB2 grid type 204 (curvilinear orthogonal grids).
This grid type is supported without coordinate data. Notably, however, the example file
contains its own coordinate data as variables in their own right.
- Added support for reading (NCEP) Climate Forecast System
Reanalysis (CFSR): 1979-2010 files. These GRIB2 files have a non-standard method for
specifying statistical-process variables.
- Added support for product template 4.15 which defines statistical processes over
a spatial region. This included adding a new attribute "type_of_spatial_processing" for statistical
spatial variables as well as statistical
suffixes to the variable names (e.g. _avg, _max) in order to
distinguish otherwise identical variable names.
- Added support for GRIB2 files from NWS National Digital Forecast Database, which use an unusual form of record packing. These files are available from http://www.weather.gov/ndfd/anonymous_ftp.htm. (Thanks to Jennifer Adams, GrADS developer, for bringing them to our attention.)
The GRIB2 code tables have been extensively revised to bring them up-to-date with the currently documented state of the parameter tables primarily as defined by NCEP in links from the parameter category page at http://www.nco.ncep.noaa.gov/pmb/docs/grib2/grib2_table4-1.shtml. ECMWF tables, as documented at http://www.ecmwf.int/publications/manuals/d/gribapi/fm92/grib2/show/parameter/, were also consulted with the goal of harmonizing the parameter lists and descriptions as much as possible. The number of defined parameter has almost doubled, increasing from 371 to 701. This should eliminate most of the warnings about unrecognized parameters. Unfortunately, this process has led to some unavoidable backwards incompatibilities, primarily due to changes in the short names that form the base name for PyNIO variables that represent the aggregated GRIB records. To be exact, 92 of the original 371 short parameter names have changed.
Users for whom this is a problem can revert to the previous version of the tables by following these steps:
Now when any GRIB2 file is opened using PyNIO, it will use this previous version of the code tables.
- Updates and changes to GRIB1 reader:
- Added the following new GRIB1 parameter tables:
- ECMWF Parameter table version 133
- ECMWF Parameter table version 171
- ECMWF Parameter table version 172
- ECMWF Parameter table version 173
- ECMWF Parameter table version 174
- ECMWF Parameter table version 175
- ECMWF Parameter table version 201
- ECMWF Parameter table version 210
- ECMWF Parameter table version 211
- ECMWF Parameter table version 228
- ECMWF Parameter table version 230
- ECMWF Parameter table version 234
- US Weather Service - NCEP (Parameter table version 133)
- US Weather Service - NCEP Aviation World Area Forecast/ICAO (Parameter table version 140)
- US Weather Service - NCEP (Parameter table version 141)
- Japanese Meteorological Agency (Parameter table version 3)
- Updated the following GRIB1 parameter tables:
- ECMWF Parameter table version 128
- ECMWF Parameter table version 129
- ECMWF Parameter table version 131
- ECMWF Parameter table version 132
- ECMWF Parameter table version 140
- ECMWF Parameter table version 151
- ECMWF Parameter table version 160
- ECMWF Parameter table version 162
- ECMWF Parameter table version 190
- ECMWF Parameter table version 200
- US Weather Service - NCEP Oceanographic Parameters (Parameter table version 128)
- US Weather Service - NCEP (Parameter table version 129)
- US Weather Service - NCEP Land Modeling and Land Data Assimilation (Parameter table version 130)
- US Weather Service - NCEP North American Regional Reanalysis (Parameter table version 131)
- Support was added for one form of complex packing in GRIB1: specifically row by row complex packing without secondary bit maps.
- Added the following new GRIB1 parameter tables:
PyNGL Version 1.3.0b4 - April 1, 2010
- New graphical output devices available.
We've added some new graphical output formats (workstation types). These are based upon an experimental graphics driver, and are considered beta-level capabilities:
- "png" or "newpng" for PNG output
- "newps" for PostScript
- "newpdf" for PDF
These formats can be used with Ngl.open_wks:
   wks = Ngl.open_wks("png","test")      ; Will create "test.000001.png"
   wks = Ngl.open_wks("newpdf","test")   ; Will create "test.pdf"
   wks = Ngl.open_wks("newps","test")    ; Will create "test.ps"
The "newpdf" workstation generally produces smaller output files than the original "pdf" type. Unfortunately, the "newps" output does not produce smaller PostScript files.
The "newps" and "newpdf" formats will remain in test mode for awhile, and may eventually replace the original "ps" and "pdf" formats. The original formats may be kept for backwards compatibility.
The old "png" format, which was never officially advertised, has been replaced by the new graphics driver; "png" is now synonymous with "newpng".
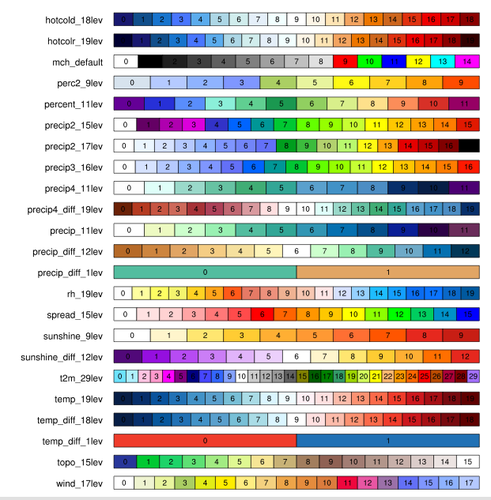
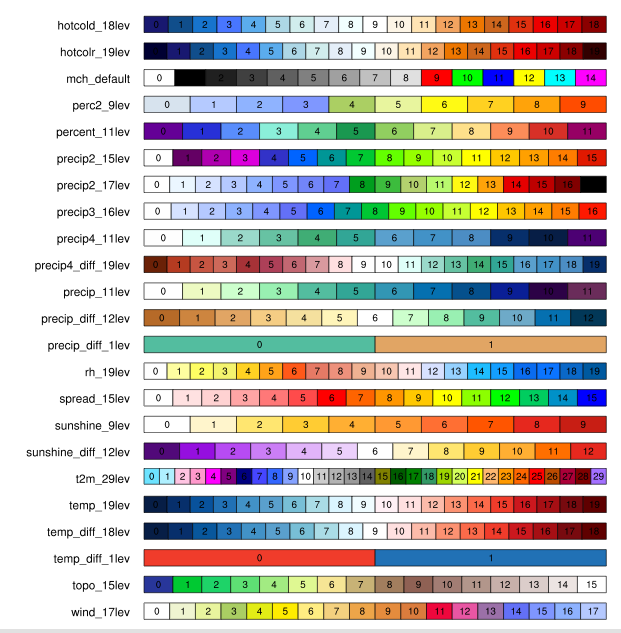
- New color tables donated by MeteoSwiss.
Click on image for larger version.
- Added new resources that allow you to mask a Lambert
Conformal map, nglMaskLambertConformal
and nglMaskLambertConformalOutlineOn.
See the "conmasklc.py" example on the gallery page.
- There are two new ways to set the paper width and height for PS/PDF
output, if you don't want the default 8.5 x 11 inches. The first
way is to set wkPaperSize
to a string like "A4", "legal", "ledger", etc.
The second way is to set the width and height directly using resources wkPaperWidthF and wkPaperHeightF. These resources are replacing nglPaperWidth and nglPaperHeight.
- A memory problem with Ngl.vinth2p was fixed.
Version 1.3.0b1 - August 18, 2008
This is our first open source version of PyNGL and PyNIO, and these two packages are now being released separately.
The source code licenses for PyNIO and PyNGL are similar to the The University of Illinois/NCSA Open Source license.
The binary licenses for PyNIO and PyNGL are similar to the old binary license for the previous versions. A separate binary license is necessary because of the additional 3rd party software included.
New features and augmentations in PyNGL
- New analysis functions:
- Ngl.betainc - Evaluates the incomplete beta function.
- Ngl.chiinv - Evaluates the inverse chi-squared distribution function.
- Ngl.linmsg - Linearly interpolates to fill in missing values.
- Ngl.regline - Calculates the linear regression coefficient between two series.
- New visualization and related functions:
- Ngl.datatondc - routine for converting between data space and NDC space.
- Ngl.ndctodata - routine for converting between NDC space and data space.
- Ngl.streamline_scalar - routine for generating streamlines colored by scalar fields.
- Ngl.streamline_scalar_map - routine for generating streamlines colored by scalar fields over a map.
- Ngl.wmstnm - draws station model data.
- Augmentations
- A new optional argument has been added to Ngl.asciiread to allow for the specification of a separator character, or character sequence.
- Ngl.add_cyclic,
Ngl.add_new_coord_limits,
Ngl.add_polymarker,
Ngl.add_polygon,
Ngl.add_polyline,
Ngl.contour,
Ngl.contour_map,
Ngl.polygon,
Ngl.polyline,
Ngl.polymarker,
Ngl.skewt_plt,
Ngl.streamline,
Ngl.streamline_map,
Ngl.streamline_scalar,
Ngl.streamline_scalar_map,
Ngl.vector,
Ngl.vector_map,
Ngl.vector_scalar,
Ngl.vector_scalar_map,
Ngl.xy,
Ngl.y - these plotting functions
were updated to recognize masked arrays and to not plot values
equal to the masked array's fill_value.
- Several examples in the gallery were updated to use masked arrays.
- A new optional argument has been added to Ngl.asciiread to allow for the specification of a separator character, or character sequence.
- New bar1/bar2 examples showing how to create bar charts.
- New clmdiv2 example showing how to color climate divisions by a third field.
- New ctrydiv1 example showing how to draw provinces of China and states of India.
- New datatondc example showing how to use Ngl.datatondc.
- New format example showing how to format tickmark labels.
- New ndc_grid example showing how to use Ngl.draw_ndc_grid to help place primitives using NDC coordinates.
- New streamline examples showing how to use Ngl.streamline_scalar_map and Ngl.streamline_scalar.
- New Ngl.wmstnm examples showing how to use Ngl.wmstnm.
- New nio04 example showing how to use Nio to open an existing NetCDF file and append data to a variable with an unlimited dimension.
- Some more PyNIO-specific examples will be added when available.
Extended subscripting added to PyNIO
PyNIO now supports an extended form of subscripting to specify subsets using a description string that can reference associated coordinate variables if they exist in the file. Dimensions can be transposed by varying the order of the coordinate axes in the subset specification. An option allows use of the CF 'axis' attribute, if the coordinate variable defines it, to specify dimensions using the standardized short-form aliases 'T', 'Z', 'Y', and 'X'. Depending on specification options the user can request that the data values on subset boundaries be linearly interpolated between grid points or limited to the nearest grid point. In addition, the user can use an auxiliary multidimensional variable to define a subset indirectly.
Support for maskedarray module added
By default PyNIO now returns a masked array for any variable with a '_FillValue' or 'missing_value' attribute. However, there is an option that allows the user to control this behavior in various ways. See new PyNIO options below.
When masked array data is written to a variable in a file opened for writing, masked values are replaced with the fill value specified either by the variable's "_FillValue" or "missing_value" attribute if it exists, or with the fill value currently associated with the masked array if no such attribute exists.
As mentioned in the augmentations list above, support for masked arrays has been added to many of the visualization functions and is included in some of the new analysis functions. These are the masked arrays introduced in numpy V1.0.
See the "overlay1.py" and "irregular.py" examples in the gallery for examples of using masked arrays.
The attribute "attributes" has been added to both the NioFile and NioVariable types. This attribute contains the same information as is visible in the "__dict__" attribute. It has been added to provide a closer mapping to NetCDF terminology.Use of the "__dict__" attribute to access file and variable attributes is now deprecated.
A new module-level dictionary called "option_defaults" that contains the default values of all options defined by PyNIO has been implemented. By updating this dictionary, a user can change the default value for any settable option. This default option value will be used as the value of any option that is not set by means of "options" keyword argument to the "open_file" constructor, or, if available, by the "set_option" method of NioFile.
A new PyNIO option "MaskedArrayMode" has been implemented that allows the user to control PyNIO's behavior with respect to masked arrays. The default setting is "MaskedIfFillAtt", meaning that a masked array is returned if the variable in the file has either a "_FillValue" or a "missing_value" attribute. Other possible settings are "MaskedAlways": return a masked array for all variables; "MaskedNever": always return a regular NumPy array; and "MaskedIfFillAttAndValue": return a masked array only if a fill attribute has been defined and the subset requested actually contains at least one element equal to the fill value; "MaskedExplicit": use options "ExplicitFillValues", "MaskBelowValue", and "MaskAboveValue" to explicitly set one or more fill values and/or regions to mask, ignoring any fill value attributes.
"ExplicitFillValues", by default set to None, can be set to a scalar value or a sequence of values, which all become masked in the output array. The first value is set as the fill_value attribute of the MaskedArray. This option can be combined with additional masked values specified using "MaskBelowValue", and/or "MaskAboveValue".
"MaskBelowValue", by default equal to None, can be set with a single value below which all values become masked, except that if the value is greater than the value set for "MaskAboveValue", a band of masked values is defined.
"MaskAboveValue", by default equal to None, can be set with a single value above which all values become masked, except that if the value is less than the value set for "MaskBelowValue", a band of masked values is defined.
The new option "UseAxisAttribute" is a boolean attribute that specifies whether to use the short form names "t", "z", "y", and "x" as dimension names if the coordinate variable defines the "axis" attribute. As currently implemented, this is an "either/or" choice: if set True and if the "axis" attribute is defined, attempts to use the actual dimension name rather than the short-form name will result in an error.
Note that these new options generalize the concept of PyNIO options because they are not file-format specific. These options apply for any file type.
Also a new optional argument, called format has been added to the
NioFile open_file constructor. This argument provide an
alternative to the current method of explicitly specifying file formats by adding
a "fake" suffix to the filepath argument. The format argument can be
set to any of the suffixes that can be tacked on to the filepath argument.
Do not confuse the format optional argument with the NetCDF-specific option,
"Format", used to specify different NetCDF file types.
- Instances of
PyErr_Printhave been removed from PyNIO. This changes the behavior of PyNIO in that scripts will exit unless the user traps the error in Python. This is an unavoidable incompatibility in order to bring PyNIO into compliance with standard Python practice. - Several instances of
PyMem_DELin the PyNIO code have been replaced withPyObject_DEL. - PyNIO's subscripting code has been modified to behave according to
Python semantics in cases where the slice 'start' value is greater
than the slice 'stop' value. Formerly it exhibited NCL-like behavior
in this case. That is, it would return a reversed slice (assuming a
default or positive 'step' value). Now it returns an empty array.
- Fixed a problem that enables you to retrieve area group
information for climate divisions (basically, this fix will enable you
to run the new clmdiv2.py script).
- Ngl.asciiread was fixed so that
it does not exit when encountering a blank line. This was necessary
to get PyNIO to work with Python 2.5.
- The vector plotting functions: Ngl.vector, Ngl.vector_map, Ngl.vector_scalar, and Ngl.vector_scalar_map, were fixed such that
if vcMonoLineArrowColor, vcMonoFillArrowEdgeColor, vcMonoFillArrowFillColor, or vcMonoWindBarbColor are set to False, then
a labelbar is automatically drawn (unless if lbLabelBarOn is set to False and/or pmLabelBarDisplayMode is set to "Never").
In this release of PyNGL and PyNIO, we are dropping support for Numeric. An informal survey indicated that most of not all of our users have made the transition to NumPy, or are at least planning to very soon. We are adding several new data analysis functions, and trying to keep support for Numeric and NumPy was getting to be a bit tedious.
- NetCDF variables that start with a number are not allowed
There was a change introduced in NetCDF versions 3.6.3 and 4.0 in which variable names beginning with a digit are no longer allowed.
This is actually in accordance with the documented rules, as well as the CF conventions, but was never enforced in previous versions. The NetCDF developers have decided that in order to keep past users of NetCDF happy, they will change the code back to allow such variables. This code has not yet been made official.
This has caused trouble for PyNIO in cases where GRIB files, which, in PyNIO's view, can contain parameters that begin with a digit, are copied to NetCDF.
- The coordinate space subscripting step size is calculated based on
the first two elements of the coordinate array. When the the
coordinate axis values are irregularly spaced and when not using
interpolation, non-default coordinate space step sizes can led to
strange results. Either use interpolation or use an index space step
value.
- Dimension reordering does currently not work when an extended selection string contains an indirect selection using an auxiliary multidimensional coordinate variable.
Version 1.2.0 - July 23, 2007
With this release, NumPy is now the default array module package for PyNGL and PyNIO. Numeric 24.2 will still be supported. How you import the two packages is different from previous versions: if you download the NumPy version, you can import PyNGL and PyNIO with:import Ngl, NioIf you download the Numeric version, you must import PyNGL and PyNIO with:
import PyNGL_numeric.Ngl as Ngl
import PyNGL_numeric.Nio as Nio
and then you will be able to use all the "Ngl." and "Nio." calls in the usual way.
New functionality
- GRIB 2 reader
This version of PyNIO includes a new GRIB2 reader. Detailed information will be available soon in the PyNIO documentation.
- Coordinate variables for HDFEOS Swath and Grid data
This version of PyNIO recognizes the Geolocation variables provided with HDFEOS Swath data and also supplies coordinate variables for HDFEOS Grid data. Detailed information will be available soon in the PyNIO documentation.
- Beta level support for Classic model NetCDF 4
Note: netCDF-4 has not been tested on 64-bit systems yet, so PyNIO only supports netCDF-3 files on those systems.
On systems where we could build the 4.0 beta version of netCDF-4, this version of PyNIO can read and write NetCDF 4 files that conform to the classic model. The classic model constrains the interface to the constructs provided by NetCDF 3 and earlier. However, the underlying file format, like that of all NetCDF 4 files, is HDF 5. Files written in this format can take advantage of the built-in file compression available in HDF 5. This release provides beta-level support because NetCDF 4 and the release of HDF 5 that it depends on are both still in the beta-testing phase of development. Detailed information is available in the PyNIO documentation.
New functions
- Ngl.add_new_coord_limits - adds new minimum/maximum values to X and/or Y coordinate arrays.
- Ngl.draw_ndc_grid - draws and labels grid lines at 0.1 NDC intervals.
- Ngl.define_colormap - defines a new color map for the given workstation.
- Ngl.generate_2d_array - generates nice smooth 2D arrays.
- Ngl.merge_colormaps - merges two color maps to create a new color map for the given workstation.
New color tables
- BlueDarkOrange18
- BlueDarkRed18
- BlueGreen14
- BrownBlue12
- Cat12
- GreenMagenta16
- posneg_1
- posneg_2
- prcp_1
- prcp_2
- prcp_3
- StepSeq25
New resources
- nglXRefLine/nglYRefLine - adds an X or Y reference line to an Ngl.xy or Ngl.y XY plot.
- nglXRefLineColor / nglYRefLineColor - changes the color of an X or Y reference line.
- nglXRefLineThicknessF / nglYRefLineThicknessF - changes the thickness of an X or Y reference line.
New pynglex examples
- multi_plot.py (new)
- spaghetti.py (new)
Version 1.1.0 - November 9, 2006
With this release of PyNGL and PyNIO we now support both NumPy 1.0 and Numeric 24. Support for these two array modules is done via two separate packages that can safely be installed together.In order to use the Numeric version, which is currently considered the default mode for PyNGL and PyNIO (but won't be once NumPy is considered to be the more prevalent package used), you just need to import Ngl and Nio:
import Ngl
import Nio
To use the NumPy 1.0 version, you need to import PyNGL_numpy and PyNIO_numpy:
import PyNGL_numpy.Ngl as Ngl
import PyNGL_numpy.Nio as Nio
New functions
- Ngl.delete_wks
- Deletes a workstation object.
- Ngl.gc_tarea
- Finds the area of a spherical triangular patch.
- Ngl.gc_qarea
- Finds the area of a convex quadrilateral spherical patch.
Version 1.0.0 - July 12, 2006
This release of PyNGL and PyNIO was built with Python 2.4.3 and Numeric 24.2. We also have a test version that was built with NumPy version 0.9.8. Both versions are available for download on the Earth System Grid website.
- New website
- PyNGL/PyNIO has a newly-designed and significantly improved website.
- Support for NumPy version 0.9.8
- There's a test version of PyNGL and PyNIO available that works
with NumPy version 0.9.8. You can download this version from the same place as
the Numeric version, on the Earth System Grid website.
Both versions can be installed on the same system as they will not
conflict with each other (the package names are "PyNGL" and
"PyNGL_numpy").
The test NumPy version must be imported with:
    import PyNGL_numpy.Ngl as Ngl
    import PyNGL_numpy.Nio as Nio
while the Numeric version of PyNGL and PyNIO can be imported with:import Ngl import NioDue to the changing nature of NumPy (as it goes through several test phases), we can't guarantee that this test version will work with other versions of NumPy. We are interested in feedback, so please let us know if you download this version and have any kind of success with it.
- Changes to default graphical environment
- Based on our experience with other graphics packages we develop,
we decided to change the default graphics environment for PyNGL. We
believe these changes are for the better, but if you don't agree, you
can change the default graphical environment for your site using a
file called the "sysresfile."
Here's a summary of the changes:
- The default background color is white and the default foregound color is black for all graphical output (PostScript, PDF, X11 window, and NCGM). Previously, it was the reverse.
- The default font is helvetica instead of times-roman.
- The default color table is now "rainbow". It was previously "default".
- The default function code is now a tilde ('~') instead of a colon (':').
- Updates to PyNIO
- New 'print' methods were added for the NioFile and NioVariable objects. These print a
nicely formatted summary of the contents of a file or an individual variable.
A new 'options' argument was added to 'open_file' to provide support for a number of format-specific options for GRIB and netCDF files. These options allow you to create larger NetCDF files using the 64 bit offset format variant, improve performance when reading or writing large netCDF files, and control various aspects of GRIB files, such as the type of interpolation used to read data on thinned grids.
Doc strings were added for the Nio module and all its objects, methods, and attributes.
- New resources added (at the moment, only one)
- nglPointTickmarksOutward
- New functions added
- Several new functions were added:
- Ngl.free_color - Removes a color entry from a workstation.
- Ngl.maximize_plot - Maximizes the size of the given plot on the workstation.
- Ngl.new_color - Adds the given color to the end of the color map of the given workstation.
- Ngl.new_dash_pattern - Adds new dash patterns to the existing table of dash patterns.
- Ngl.new_marker - Adds new markers to the existing table of /marker styles.
- Ngl.pynglpath - Returns full path names for selected abbreviated names.
- Ngl.set_color - Sets a color in the color map of the given workstation.
- Docstrings added for PyNGL functions
- Python docstrings were added for all of the PyNGL functions.
- Updates to functions
- Many PyNGL functions were updated to handle input types of scalar, tuples, lists, and Numeric arrays.
- More examples added
- Several examples were added, including:
- coast1.py - generates coastal outlines using three different levels of resolution
- contour1.py - shows how to turn a linear axis into a log axis
- contour2.py - uses shading patterns and fill colors to fill contours
- contour3.py - uses dashed line patterns to dash negative contour lines
- contour_xyz.py - contours random X, Y, Z data
- color2.py - uses named colors in a multi-curve XY plot
- color3.py - draws HSV color wedges and shows how to use color conversion functions
- color4.py - uses named colors to generate common colors
- color5.py - draws a Mandelbrot set
- map2.py - draws polygons, polymarkers, and polylines on a map
- multi_y.py - generates multiple Y curves with their own axes
- overlay.py - draws multiple overlays of contours and vectors on a map
- thickness.py - shows how to create various line thicknesses
- scatter2.py - shows how to create your own markers
- xy1.py - shows how to change the style of the axes in an XY plot
- xy2.py - attaches primitives (polygons, polylines, etc.) to a plot
- vector_pop.py - generates vectors on a POP grid
For a quick look at all of the available examples, see the new PyNGL gallery.
- Updates to Skew-T resources
- All of the Skew-T resources associated with the Ngl.skewt_bkg and Ngl.skewt_plt functions have been renamed to
be more consistent with the rest of the PyNGL resources. The old
names will still work. To see the new names, go to the Skew-T resources page.
Version 0.1.1b8 - September 22, 2005
- Nio module - a Python module that
allows read and/or write access to a variety of data formats (netCDF,
GRIB1, HDF4, HDF-EOS2, CCM History tape) using an interface modelled
on netCDF. This module is part of the PyNGL version 0.1.1b8
distribution.
- All of the nglxxp.py and
other pynglex examples were converted to
use the new Nio module.
- New functions
- Ngl.add_annotation - adds one graphical object or plot as an annotation of another plot
- Ngl.nngetp - retrieves control parameter values for Ngl.natgrid
- Ngl.nnsetp - sets control parameter values for Ngl.natgrid
- Ngl.remove_annotation - removes an annotation from a plot
- Ngl.remove_overlay - removes a plot that was overlaid with the Ngl.overlay procedure
- Ngl.vinth2p - interpolates from CCSM hybrid coordinates to pressure coordinates
- New pynglex examples
Note: to run any of these examples, type "pynlgex xxxxx", where xxxx is one of the names in the list below:
- chkbay - generates a contour plot of triangular mesh data
- gaus - generate gaussian latitudes and weights for a specified number of latitudes
- meteogram - generates a meteogram based on code from John Ertl at the Fleet Numerical Meteorology and Oceanography Center
- multi_y - generates a two-curve XY plot with different Y axes for each curve
- nio_demo - demo program for the new Nio file I/O module
- topo1 - generates a nice-looking topographical contour plot using data from the USGS Earth Resources Observation System Data Center
- traj1 - generates a trajectory plot
- vinth2p - demonstrates use of Ngl.vinth2p function for interpolating from CCSM hybrid coordinates to pressure coordinates
- Example ngl04p.py converted
to read a GRIB file (instead of a netCDF file).
New location for PyNGL binaries - April 5, 2005
As of April 5, the PyNGL binaries are housed on the Earth System Grid website. For more information, see the download instructions.
Version 0.1.1b7 - March 17, 2005
- New functions
- Ngl.legend_ndc - draw legends positioned using NDC coordinates.
- Ngl.labelbar_ndc - draw labelbars positioned using NDC coordinates.
- Ngl.skewt_bkg - draw charts for skewt plot backgrounds.
- Ngl.skewt_plt - draws skewt plots.
- Ngl.gc_interp - interpolated points along a great circle.
- Ngl.gc_dist - calculates the distance along a great circle between two coordinates.
- Ngl.gc_convert - converts great circle distances to different units.
- Ngl.wmbarb - draws wind barbs.
- Ngl.wmbarbmap - draws wind barbs over maps.
- Ngl.wmsetp - sets parameter values for wmxxx functions.
- Ngl.wmgetp - retrieves parameter values for wmxxx functions.
- Ngl.get_named_color_index - self-explanatory.
- Ngl.fspan - returns an array of equally spaced floating point numbers in an inclusive specified range.
- New pynglex examples
- labelbar - draws label bars using Ngl.labelbar_ndc.
- legend - draws legends using Ngl.legend_ndc.
- skewt1 - draws skew-T charts using Ngl.skewt_bkg.
- skewt2 - draws skew-T plots with and without wind barbs using Ngl.skewt_plt.
- skewt3 - draws skew-T plots using real data using Ngl.skewt_plt.
- wmbarb - draws wind barbs using Ngl.wmbarb.
- wmbarbmap - draws wind barbs over maps using Ngl.wmbarbmap.
- irregular - shows how to linearize or "logize" an irregular axis, using the special resources "nglXAxisType" and "nglYAxisType".
- Bug fixes
- If cnFillColors or vcLevelColors are set, then nglSpreadColors gets set to False (if it's not already set).
- Check for tmEqualizeXYSizes setting. If it is not set, then default nglScale to True.
- Changed the retrieval of the resources trXCoordPoints and trYCoordPoints to be a multi-dimensional array (instead of a 1D array). This handles the case of the arrays being 2D.
Version 0.1.1b6 - January 12, 2005
- Release for internal testing. Never publically released.
Version 0.1.1b5 - December 12, 2004
- Added a couple of new pynglex examples, "color1.py" and "streamline.py".
- Made some minor changes so PyNGL will work with Python version 2.4.
Version 0.1.1b4 - December 10, 2004
- Fixed a minor bug fix that involved using Ngl.set_values in conjunction with having used one of the new nglX/YAxisType resources.
Version 0.1.1b3 - December 8, 2004
- Plot defaults
Some more default values for plot resources were added to help automate things for the user.
- New resource for renaming application resource file
A new resource called nglAppResFileName was added. This resource allows you to change the default name of the resource file. This resource can only be set during a call to Ngl.open_wks.
With this resource, you can also set two resources, appUsrDir and appFileSuffix, which allow you to change the default directory location of a resource file (the default is "./") and to change the suffix (default is ".res").
- New resources for forcing an irregular X and/or Y axis to be
linear or log
Two new resources called nglXAxisType and nglYAxisType were added. These resources allow you to convert an irregular X or Y axis to linear or log. They should only be used if one of the scalar or vector field resources (sfXArray/sfYArray or vfXArray/vfYArray) have been set.
For an example, run:
pynglex irregular
- Bug fixes
- Even though the PNG driver is not fully operational, we went ahead
and uncommented its code so users can test it out. You can get at the
PNG driver by setting your workstation type to "png" in your call to
Ngl.open_wks.
- Fixed the error checking for the special "ngl" resources, so
that if any of them are misspelled, PyNGL will report it.
- Even though the PNG driver is not fully operational, we went ahead
and uncommented its code so users can test it out. You can get at the
PNG driver by setting your workstation type to "png" in your call to
Ngl.open_wks.
Version 0.1.1b1 - October 18, 2004
- Major changes
The big change in this version was the removal of the "ngl_" prefix from the names of all of the PyNGL plotting functions. This change was made due to feedback from PyNGL testers who suggested that:
import Ngl
was preferrable to:from Ngl import *
Moving to this method made us realize that "Ngl.ngl_xxxx" would be redundant, and hence the "ngl_" prefix was removed. All documentation and examples were updated to reflect this change. - Several new "pynglex" examples added
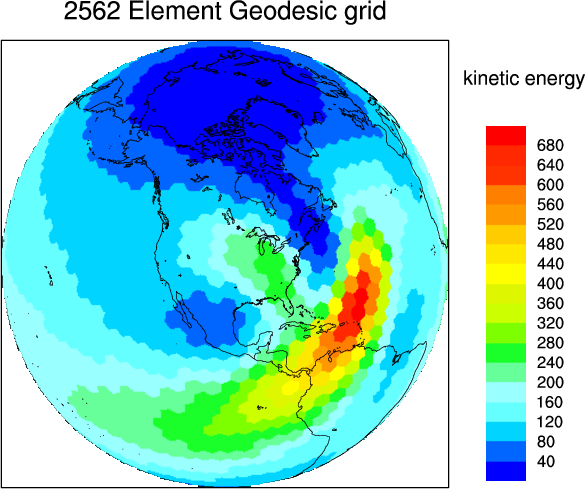
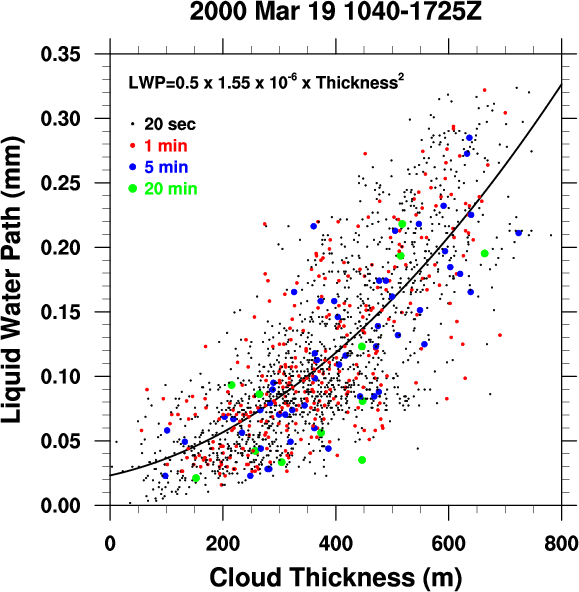
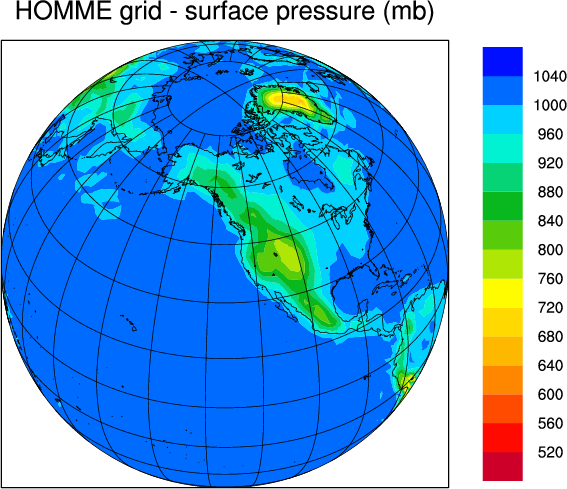
Since the last release, several new examples were added, and documentation for pynglex was written. Three of the new examples show how to draw contours on unique grids and/or triangular meshes. The fourth example shows how to draw a nice scatter plot using colorful polymarkers.
To generate the new examples, type:
pynglex geodesic seam ctnccl scatter1
and view the resultant PostScript files. Below is a sample of the graphics created from these new examples. Click on any image for a larger view:geodesic * scatter1 seam 
* The geodesic grid came to us from Dave Randall, Ross Heikes, and Todd Ringler of Colorado State University.
- Plot defaults
Some default values for plot resources were changed to help automate things for the user. For example, if the user turns on contour fill, then he/she will automatically get a labelbar on the plot. For a full list of such resources, see "Default resource settings for PyNGL graphics".
- Documentation updated
The PyNGL documentation was updated to reflect all of the above changes.
- Bug fixes
- The nglScale resource
was set to True, as documented.
- If the wkOrientation
resource is set, then the orientation will not get recalculated when
the plot size is maximized to best fit in the output device. Note that
if nglPaperOrientation is set, it will
override the setting for
wkOrientation.
- The nglScale resource
was set to True, as documented.