
PyNGL and PyNIO Frequently Asked Questions
The frequently asked questions listed below assume you have some basic knowledge of PyNIO and PyNGL.
General questions
- Are PyNIO and PyNGL still being actively maintained?
- What version(s) of Python are PyNGL and PyNIO supported under?
- How do I change the default NCGM/PostScript/PDF file name to something else?
- How do I set up my PyNGL script so that it uses a resource file?
- How do I change all of my fonts to be the same font?
- How do I get access to special characters, like Greek symbols?
- Can I access PostScript fonts in my PyNGL script?
- How do I retrieve an environment variable in PyNGL?
- How can I change the text function code to something other than the default?
- My text strings in my plots either have garbage in them or they are not getting fully displayed. What's the problem?
- How do I call a C or Fortran function or procedure from PyNGL?
- How do I change the aspect ratio or size of my plot?
- How do I get multiple plots on a page?
- I've got multiple contour plots on one page and want to create one labelbar that represents all of them. How do I do this?
- What's a good way to generate a color map from within PyNGL?
- Can I set color resources by color name rather than color index values?
- Can I change color index values or color maps in mid-frame?
- How do I get my PostScript/PDF output to cover most of an 8-1/2" x 11" page?
- When I try to create a plot, I'm getting an error message about workspace reallocation exceeding maximum size. How can I fix this?
- When I try to import Ngl and/or Nio, I get
an error about the libpng library not being current.
Reading/writing data files and accessing variables and attributes
- How do I read/write netCDF, HDF, GRIB, or CCM History Tape files?
- How do I read/write ASCII files?
- How do I deal with NaN's (not a number) in my data?
- I'm trying to set the
_FillValue attribute for my data, but getting an error message.
Data processing questions
- How do I set a missing value for my data?
- How do I determine if my data contains any missing values?
- Are there any interpolation functions in the
PyNGL module?
Plotting questions
- How do tell PyNGL not to plot missing values in my contour, vector, streamline, or XY plot?
- How do I get log scaling in an XY or contour plot?
- How do I fill my contour levels with various shading patterns and/or solid colors?
- How do I change the attributes of a curve, or curves, in an XyPlot?
- How do I overlay a contour plot (or a vector/streamline plot) on a map?
- How do I label the latitude/longitude lines on my map?
- Can I improve the resolution of my map outlines?
- If I am creating a color contour or vector plot, how do I select my colors such that they are spread across my whole color map?
- How do I get multiple scales on my XY or contour plot?
- How can I have a double quote appear as part of a text string in PyNGL?
- How can I have a new line appear as part of a text string in PyNGL?
- How can I draw to an X11 window and use keyboard input for plotting control without having to do a mouse click?
- How come I get different line thicknesses on different output devices using the same thickness value?
Post-processing questions
- How do I convert my PyNGL graphics file to another format, like GIF or PNG, to put on the web?
- How do I convert my multi-frame NCGM file to individual PNG files?
- How do I convert my multi-frame PostScript file to individual PNG files?
- If I obscure a PyNGL X11 window with
another application, the window doesn't refresh when I bring it back
to the front.
Documentation questions
- Where can I see a list of all the PyNGL resources?
- Where can I see a list of all the PyNGL functions?
- Where can I see some examples of how to use PyNGL?
General questions
- Are PyNIO and PyNGL still being actively maintained?
Yes, you can see our download page
to see the latest versions.
We recognize that the PyNGL/PyNIO website looks very tired and out-of-date, and appreciate your patience as we do plan an overhaul. Stay tuned!
- What version(s) of Python are PyNGL and PyNIO supported under? PyNIO is available for Python 2.x and 3.x, and PyNGL is available for Python 2.x, with a Python 3.x released expected August 2018.
- How do I change the default NCGM/PostScript/PDF file name to
something else?
Just change the second argument in the call to Ngl.open_wks. Here's an example of changing the NCGM file name to "plot1.ncgm":
import Ngl

#
# Create an NCGM Workstation and change the name of the
# metafile to "plot1.ncgm".
#
wks = Ngl.open_wks("ncgm","plot1")

mapid = Ngl.map(wks)

Ngl.end()
- How do I set up my PyNGL script so that it uses a resource file?
See the resource files page for full details on resource files.
If you call Ngl.open_wks to open a workstation, then the string in the second argument allows you to name a resource file to read in. For example, if you have the following PyNGL script:
import Ngl

# Create an X Workstation object.
wks = Ngl.open_wks("x11","title_app")

# Draw a text string
Ngl.text_ndc(wks,"Hello, World",0.5,0.5)

Ngl.frame(wks)
Ngl.end()
then it will look for a resource file called "title_app.res". If you then have the following lines in your "title_app.res" file:*txFontColor : Red *txFont : helvetica-bold *txFontHeightF : 0.06
you should see a large, red "Hello, World" string in the center of the frame using the helvetica-bold font. - How do I change all of my fonts to be the same font?
First set up your PyNGL script to use a resource file (see the question on resource files above), and then in the resource file include the following line:
*Font : helveticato change all fonts to helvetica (use whatever font you want, of course). Any fonts that you are explicitly setting in your PyNGL script will override this resource file setting.For an example, see the PyNGL script "ngl08p.py", along with its resource file "ngl08p.res" and its output. Try changing "times-roman" in the "ngl08p.res" file to other fonts to see the results. Use either a font name or a font index as listed in the font table.
If you always want to use this font in all of your PyNGL scripts, then put the above line in a file called ".hluresfile" in your home directory. If PyNGL sees a ".hluresfile" in your home directory, it will always load it before running any PyNGL scripts.
- How do I get access to special characters, like Greek symbols?
You first need to find the font that your character exists in by browsing the font tables. Clicking on any one of the font names, like "math_symbols", will show you all the characters for that particular font. Once you find the character you desire, note the font table index ("math_symbols" is index 18, for example), and the corresponding character, and then you can use the text function code "F" to change the font. For example, to get a bell symbol, you would see that character "n" in the "symbol_set1" table (index 19) is a bell. You can then use the string "~F19~n~F~" in any text string resource to indicate you want a bell symbol. The "~F~" means go back to the original font.
For example, to use it in a title:
res.tiMainString = "Bell (~F19~n~F~)"
- Can I access PostScript fonts in my PyNGL script?
No. When you use PyNGL font number 4, you will get the stroked simplex_roman font, no matter what kind of workstation you are going to, even a PostScript workstation. If you change "4" to "Helvetica," then you will get PyNGL font 21, i.e. a Helvetica font that uses polygons to produce the characters and not direct access to a PostScript font.
There is some confusion about the availability of PostScript fonts, because they are accessible from low-level NCAR Graphics, as per the discussion on PS vs. GKS fonts. For NCAR GKS fonts numbered 1 and -2 through -34, the PostScript drivers access the standard 13 PostScript fonts (oblique and bold-oblique are supported, i.e. font numbers -23, -24, -27, -28, -31, -32). For fonts -2 through -20 (the Hershey fonts) a mapping is done to equivalent PostScript fonts when possible. If a character is not available (like the script fonts or road map signs), then one would have to use Plotchar. We hope to add the ability to access PostScript fonts from PyNGL in the future.
- How do I retrieve an environment variable in PyNGL?
Use the environ function of the Python os module:
path = os.environ["PATH"] - How can I change the text function code to something other than
the default?
If you are using a standard implementation of PyNGL, the default function code is a tilde: "~". To change the function code to another character when using the Ngl.text, Ngl.text_ndc, or Ngl.add_text procedures, set the txFuncCode resource:
txresources.txFuncCode = "^"If you want your text function code permanently changed for every single text resource you ever use in all of your PyNGL scripts, then set the global resource "TextFuncCode", which can only be set in a resource file. This resource is best set in the file "~/.hluresfile" as follows:*TextFuncCode : ^The ".hluresfile" file must be in your home directory in order for PyNGL to see it and load it. - My text strings in my plots either have garbage in them or they
are not getting fully displayed. What's the problem?
If you are also getting error messages that look like this:
PLCHHQ - CHARACTER NUMBER 10 (w) IS NOT A LEGAL FUNCTION CODEthen most likely the problem is that you have a tilde character ("~") in your string. By default, if PyNGL sees a tilde in your string, it's expecting the next character to be a special "function code."To get around this, you need to tell PyNGL that you don't want the tilde character to represent the start of a function code. See the previous question on how to change your text function code.
- How do I call a C or Fortran function or procedure from PyNGL?
For extending with C or C++, see Extending and Embedding the Python Interpreter. This page describes how to write modules in C or C++ to extend the Python interpreter with new modules. Those modules can define new functions but also new object types and their methods. It also describes how to embed the Python interpreter in another application, for use as an extension language. See also SWIG.
For extending with Fortran, see f2py.
- How do I change the aspect ratio or size of my plot?
You can use the viewport resources vpWidthF and vpHeightF. The viewport coordinates are normalized; that is, they take values from 0.0 to 1.0 (inclusive). For example, if you want your plot to be twice as long as it is high, then you might set vpWidthF to 0.4 and vpHeightF to 0.8.
Please note that in order to change the aspect ratio of a map projection, you must also set the resource mpShapeMode to "FreeAspect".
For an example of changing the aspect ratio of a cylindrical equidistant map, see the PyNGL script "map1.py" and its output (frame 1 and frame 2).
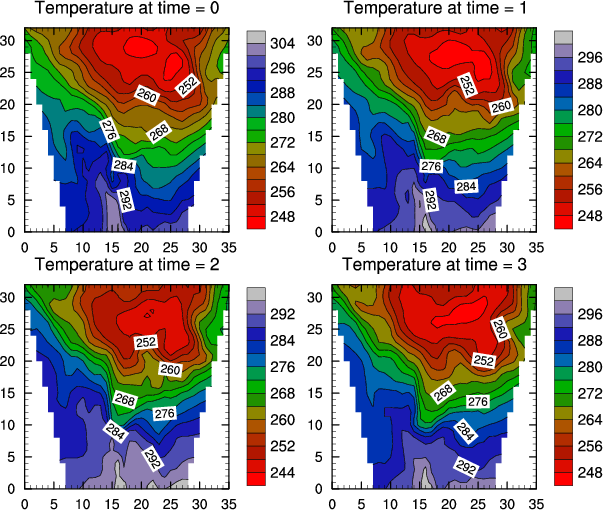
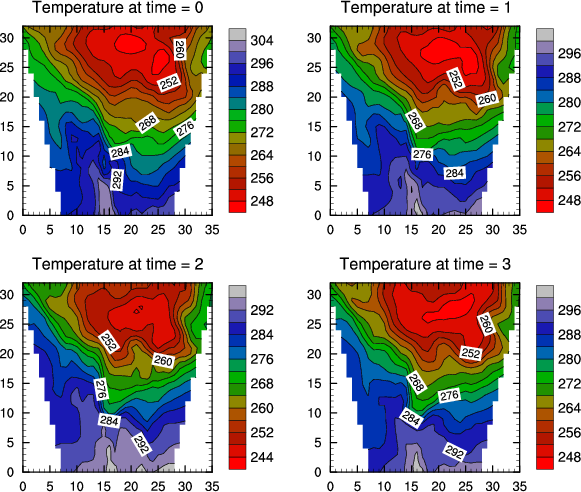
- How do I get multiple plots on a page?
If your plots are all the same size, then you can use the PyNGL procedure Ngl.panel that takes as input the workstation you want to draw the plots on, the list of plots you want to put on one page, an array describing the layout of the plots, and an optional list of resources. For an example of using Ngl.panel, see the script "panel1.py" and its output (frame 1 and frame 2).
- I've got multiple contour plots on one page and want to
create one labelbar that represents all of them. How do I do this?
See the answer above to the question "How do I get multiple plots on a page?" The example there shows how to get the desired label bar.
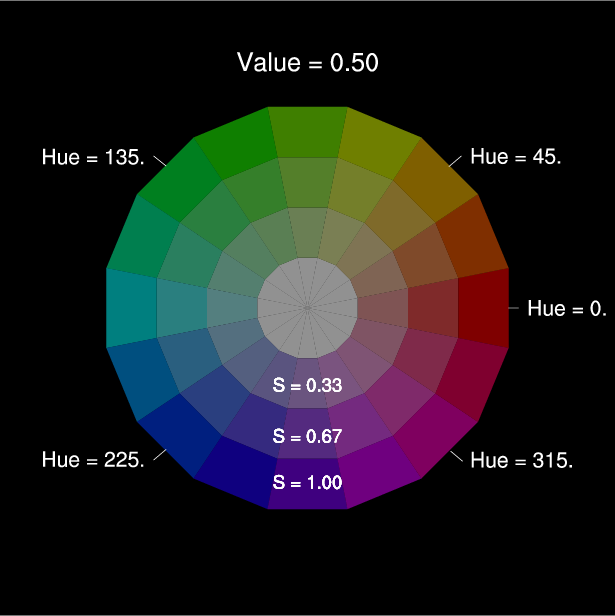
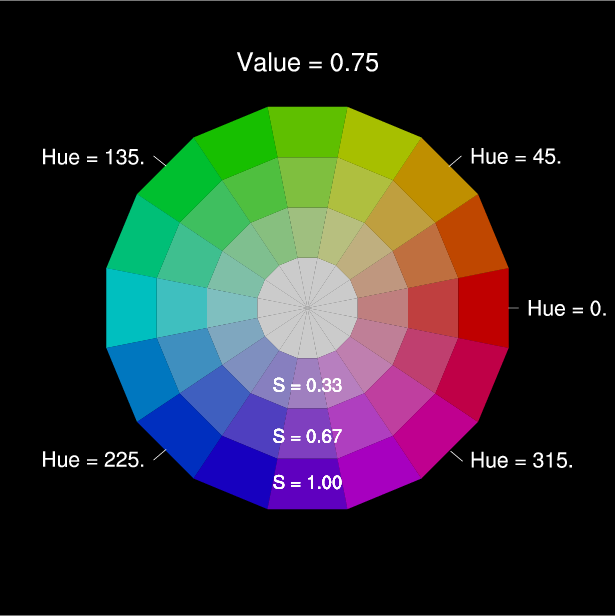
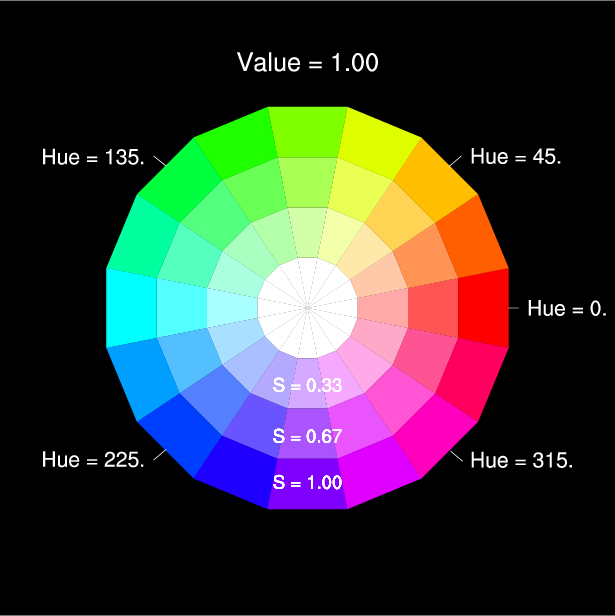
- What's a good way to generate a color map from within PyNGL?
First see the section "Creating your own color map using HSV values" for an introduction to the HSV color wheel and how it helps you create a color map. Then, have a look at the color3 example and its output (frame 1, frame 2, frame 3). The function Ngl.hsvrgb is in the Ngl module.
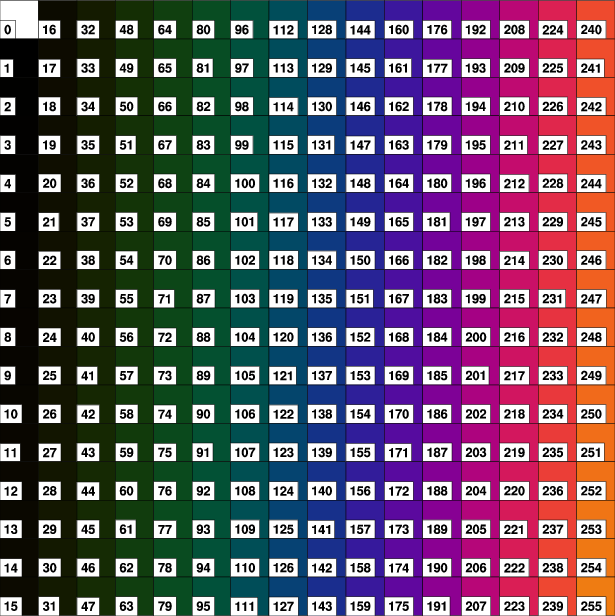
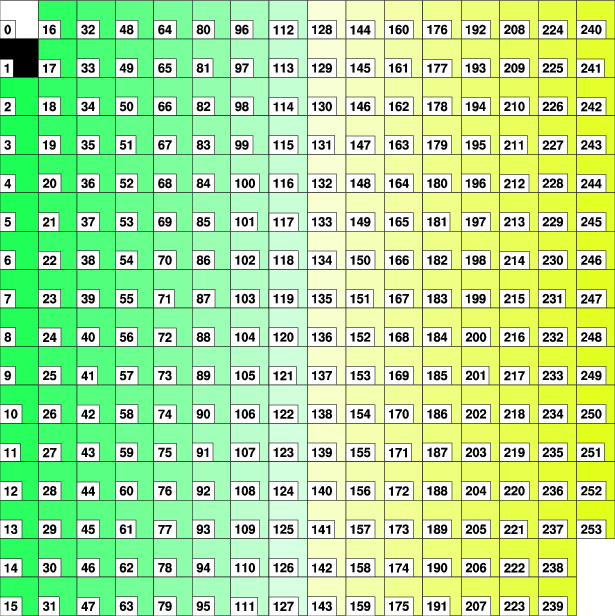
You can use the PyNGL function Ngl.draw_colormap to draw the current color map associated with the workstation. For an example, see the PyNGL "color1.py" script and frame 1 and frame 2 of its output.
- Can I set color resources by color name rather than color
index values?
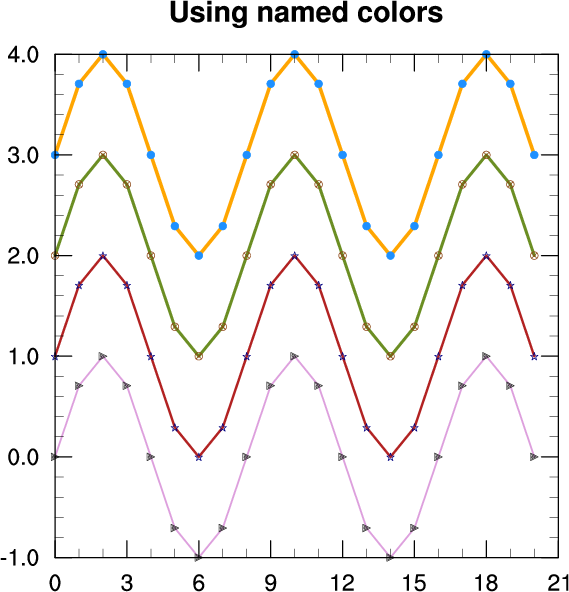
See the "Creating your own color map using named colors and RGB values" section.
-
Can I change color index values or color maps in mid-frame?
The main consideration in doing this is changing the background color. If the background color is changed in mid-picture (color index 0), then in most cases at the time you change the background color your entire frame will be overwritten with that color. As long as you do not change the background color in mid-picture, your results should be as desired. See the simple example below.
Trying to swap in an entire new color map is problematic, again primarily due to considerations with resetting the background color. If you are producing PS or PDF output and if your background color is the default, then things should work. Things should work in all cases in going to NCGM and translating with ctrans. Producing X11 output works unless you specifically reset the background color.
But, to be on the safe side, what will work in all cases is starting off with any color map and then redefining any color indices except the background. For example, if you have a color table with 256 defined colors and want to replace that in mid-picture with a different color table, use the function Ngl.set_color to redefine all color index values except for index 0. The logic in the following example illustrates this:
import numpy,Ngl res = Ngl.Resources() # # Draws cells, fitting them into a box with lower left corner (xll,yll) # and upper right corner (xur,yur) with nx cells in x and ny cells in y. # For each call each cell is colored using increasing indices in the # current color map *starting with color index 2*. # def draw_cells(wks,xll,yll,xur,yur,nx,ny): xinc = (xur-xll)/nx yinc = (yur-yll)/ny for j in xrange(ny): plly = yll + j*yinc pury = plly + yinc for i in xrange(nx): pllx = xll + i*xinc purx = pllx + xinc x = numpy.array([pllx,purx,purx,pllx,pllx]) y = numpy.array([plly,plly,pury,pury,plly]) res.gsFillColor = i+j*nx+2 Ngl.polygon_ndc(wks,x,y,res) # # Define colors "black", "red", "green", "blue" in order # starting with color index 2. # cmap = numpy.array([[0.,0.,0.],[1.,1.,1.],[0.,0.,0.], \ [1.,0.,0.],[0.,1.,0.],[0.,0.,1.]]) rlist = Ngl.Resources() rlist.wkColorMap = cmap wks_type = "ps" wks = Ngl.open_wks(wks_type,"cell",rlist) # Open a PostScript workstation. # # Draw four color boxes in the lower half of the plot # using the cmap. # draw_cells(wks, 0., 0., 1.0, 0.5, 2, 2) # # Redefine color for indices 3-5. # Ngl.set_color(wks, 3, 0., 1., 1.) # cyan Ngl.set_color(wks, 4, 1., 0., 1.) # magenta Ngl.set_color(wks, 5, 1., 1., 0.) # yellow # # Draw color boxes using the redefined color map. # draw_cells(wks, 0., 0.5, 1.0, 1.0, 2, 2) Ngl.frame(wks) Ngl.end() - How do I get my PostScript/PDF
output to cover most of an 8-1/2" x 11" page?
PyNGL does this for you automatically, since the special resouce nglMaximize is set to True by default.
If you want to control the positioning of a plot in PS/PDF output, when you create your PostScript or PDF workstation use the resources wkDeviceLowerX, wkDeviceLowerY, wkDeviceUpperX, and wkDeviceUpperY. Note: For the above resources to take effect, you must set nglMaximize to False, otherwise your plot will fill the page. Note that it is possible to have negative values for these resources.
- When I try to create a plot, I'm getting an error message about
workspace reallocation exceeding maximum size. How can I fix
this?
If the error message looks something like this:
    fatal:ContourPlotDraw: Workspace reallocation would exceed maximum size
    16777216
    fatal:ContourPlotDraw: draw error
    fatal:ContourPlotDraw: draw error
    fatal:PlotManagerDraw: error in plot draw
    fatal:_NhlPlotManagerDraw: Draw error
then you'll need to bump up your workspace size. First, you need to retrieve the default workspace, and then you can set the "wsMaximumSize" resource. To do this, add the following code right after you create a workstation:ws_id = Ngl.get_workspace_id() rlist = Ngl.Resources() rlist.wsMaximumSize = 33554432 Ngl.set_values(ws_id,rlist)
You can permanently bump up the workspace size by setting wsMaximumSize in your ~/.hluresfile:*wsMaximumSize : 33554432
If you are drawing a contour plot, you might instead try switching to raster contouring, by setting the resource cnFillMode to "RasterFill". - When I try to import Ngl and/or Nio, I get an error about the
libpng library not being current.
The PyNGL and PyNIO modules may have several dependencies on the PNG library (libpng), and hence there may be a dependency on a shared version of this library. Most Linux and MacOS systems come with this library already installed.
In some cases, however, you may have an older version of this library on your system, and you'll get a complaint that it is not current enough.
We ran into one case where upgrading an Apple system from MacOS 10.5.2 to MacOS 10.5.8 solved the problem, because that caused the PNG library to be upgraded.
Linux users may be able to use "yum" or "aptitude" to upgrade their PNG library.
You can also install the library yourself, either from a precompiled binary or source code. Go to http://www.libpng.org/pub/png/libpng.html and either download a precompiled binary, or the source code (the ".tar.gz" file under "with config script").
Reading/writing data files and accessing variables and attributes
- How do I read/write netCDF, HDF, GRIB, or CCM History Tape
files?
You can use the Nio module, which is bundled with PyNGL. Nio is a Python module that allows read and/or write access to a variety of data formats using an interface modelled on netCDF. netCDF is a self-documenting and network-transparent data format - see the netCDF User Guide for details.
- How do I read/write ASCII files?
Strictly to support the examples, a very basic ASCII read function, Ngl.asciiread, was written as part of the PyNGL module. Of course all of the Python read functions are also available.
- How do I deal with NaN's (not a number) in my data?
You can use numpy to change the NaN values to missing values:
import numpy as N
var1 = N.where(N.isnan(var[:]),var._FillValue[0],var[:])
- I'm trying to set the _FillValue attribute for my data, but
getting an error message.
If you are trying to set a _FillValue attribute for your data, and getting the error message:
ncendef: ncid 65536: NetCDF: Not a valid data type or _FillValue type mismatch
then this means you are using a value that is of the wrong type for your data variable. NetCDF requires the _FillValue type to be the same type as the variable it is attached to (for good reason). Furthermore, PyNIO treats an assignment to a _FillValue just like any other attribute assignment, meaning that it does not try to convert the type it is handed.If your data variable is a "float" in NetCDF, you must assign the _FillValue as a "numpy.float32". If you assign it with the literal value "-999", it will become an integer, which will not work. Unfortunately, even if you use the value "-999.0", it will not work, because the default float type in Python (and NumPy) is "float64", known as "double" in NetCDF. So you must explicitly create a numpy "float32" value.
You can do this with:
import numpy
...
data._FillValue = numpy.array(-999.0,dtype=numpy.float32)
ordata._FillValue = numpy.array(-999.0,dtype='f')
We may try to improve this in the future by having PyNIO do some reasonable type conversion for the _FillValue attribute on assignment.Data processing questions
- How do I set a missing value for my data?
PyNGL is designed as a graphics library and, as such, it has mimimal data processing functionality. Such functionality will be a part of a future PyNGL module.
As of version 1.3.0b1, most functions in PyNGL automatically handle missing values if your array is a numpy masked array. If you don't have masked arrays and your data contain missing values, then you will have to specifically set the appropriate resources. For examples of setting vector field and scalar field missing values see tutorial example 6; for an example of setting coordinate array missing values, see tutorial example 10.
- How do I determine if my data contains any missing
values?
You will have to check the source data. For example, if you are using data from a netCDF file read in with the Nio module, then you can check if a given variable has a _FillValue or a missing_value attribute. See tutorial example 6.
- Are there any interpolation functions in the PyNGL module?
A few interpolation functions have been included in the PyNGL module, primarily in support of the examples. The 1-dimensions tension spline interpolator Ngl.ftcurv is used in tutorial example 11. The 1-dimensional tension spline interpolator for periodic data Ngl.ftcurvp is used in tutorial example 7. The 1-dimensional integral calculator for periodic data Ngl.ftcurvpi is used in tutorial example 7. The 2-dimensional interpolator for random data Ngl.natgrid is used in tutorial example 8.
Plotting questions
- How do tell PyNGL not to plot missing values in my contour or
XY plot?
If you have version 1.3.0b1 or later of PyNGL, then missing values will automatically be ignored if you pass a numpy masked array to a plotting function.
However, if you don't have a masked array, then for contour data, use the ScalarField resource sfMissingValueV (for an example, see tutorial example 9). For vector or streamline data, use the resources vfMissingUValueVand vfMissingVValueV For XY data, use the resource caXMissingV or caYMissingV (for an example, see tutorial example 10).
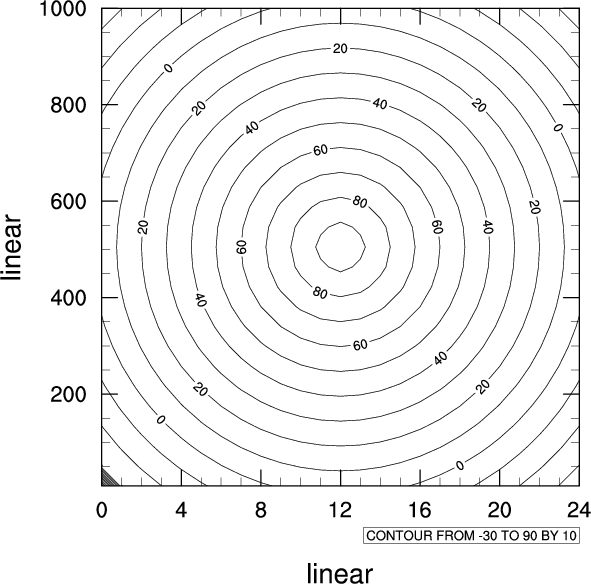
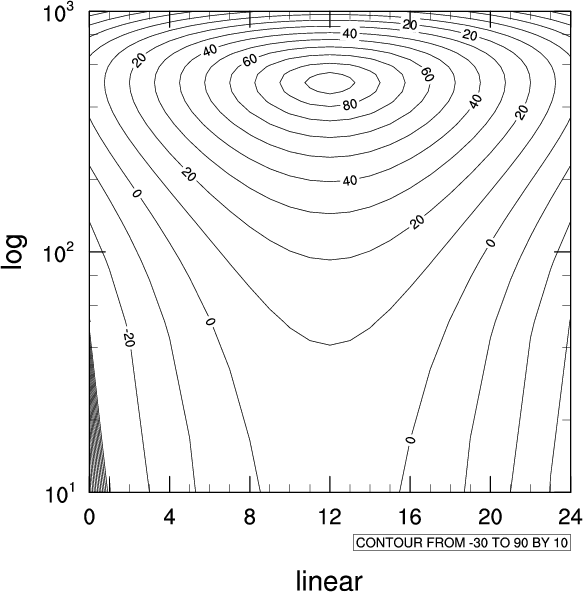
- How do I get log scaling in an XY or contour plot?
For an XY plot, set the XyPlot resources xyXStyle and/or xyYStyle to "Log" depending on which axes you want to be in log scaling. For an example see the script "xy1.py" and the output (frame 1).
For a contour plot, the method for changing to log scaling depends on whether the coordinates for the axis you want to log are regularly or irregularly spaced. If they are regularly spaced, then use trXLog or trYLog just like it was done for the XY plot above. For an example, see the example "contour1.py" and its output (frame 1 with default linear/linear scaling and frame 2 with linear/log scaling).
Log scaling for irregularly spaced data is currently not implemented.
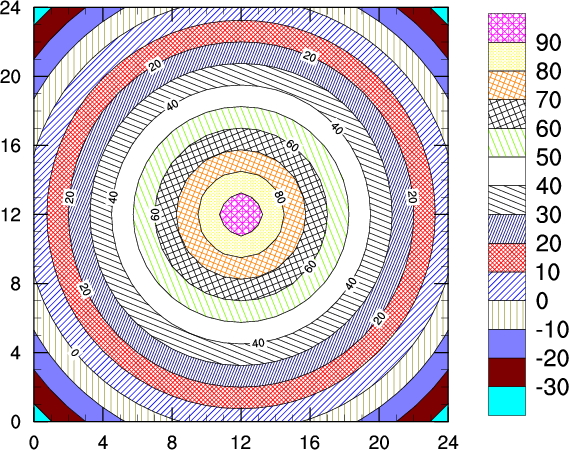
- How do I fill my contour levels with various shading patterns and/or solid colors?
If you just want to fill your contour levels with various solid colors, set cnFillOn to True. To change the default colors used for the contour levels, set cnFillColors to an array of desired color indexes (be sure to include enough colors for the number of contour levels plus one).
If you want to fill the contour levels with different shading patterns, you must set cnMonoFillPattern to False. To change the default fill patterns used for the contour levels, set cnFillPatterns to an array of desired fill pattern indexes (again, make sure you include enough fill pattern indexes for the number of contour levels plus one). There are 18 different fill patterns: pattern 0 is solid fill, patterns 1-16 are various fill patterns, and pattern 17 is a special stipple fill pattern. If you use "-1" for a fill pattern, this means to leave it transparent (no fill).
For an example showing how to create a contour plot using different fill patterns and colors, see the script "contour2.py" and the output.
- How do I get log scaling in an XY or contour plot?
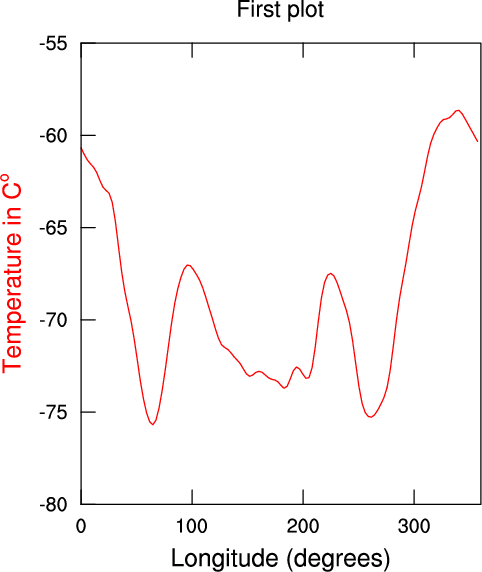
- How do I change the attributes of a curve,
or curves, in an XyPlot?
You should be able to set resources for an XyPlot just as you would for other plot objects. For an example, see the script "multi_y.py" and its first frame.
An XyPlot can have multiple curves. For an example of changing attributes for multiple curves, see the script "color2.py" and the output.
- How do I overlay a contour plot (or a vector/streamline plot)
on a map?
For contours over a map, see tutorial examples 5 and 9. For vectors, see tutorial example 6. Streamlines over maps can be handled in a similar way using Ngl.streamline_map.
- How do I get labeled latitude/longitude tickmarks on my
map?
If your projection is rectangular, then you should get lat/lon tickmarks by default. If you want to turn these off, then you can set the resource pmTickMarkDisplayMode to "Never".
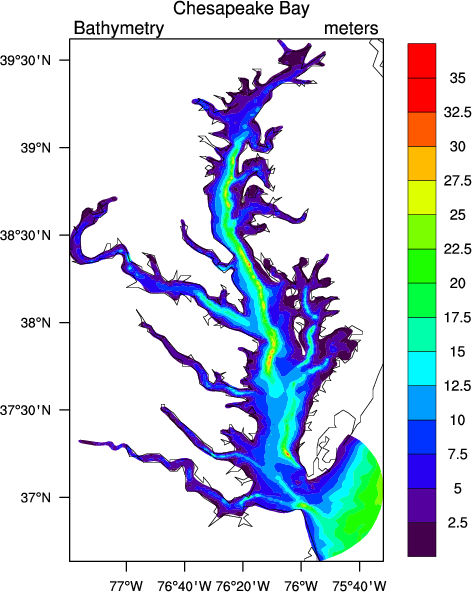
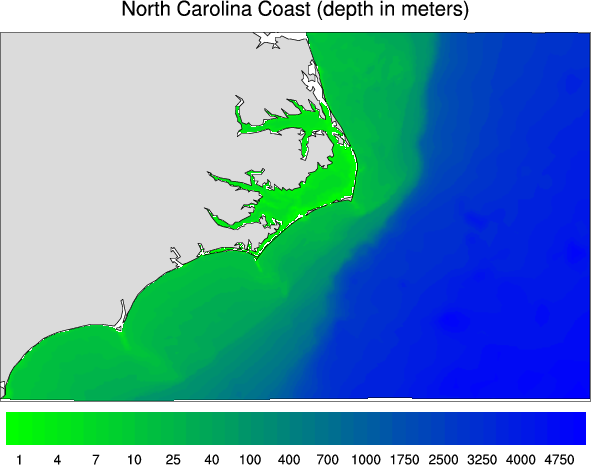
For an example that has lat/lon tickmarks, see contour plot overlaid on it, see "chkbay.py" and its output. For an example that turns these tickmarks off, see "ctnccl.py" and its output.
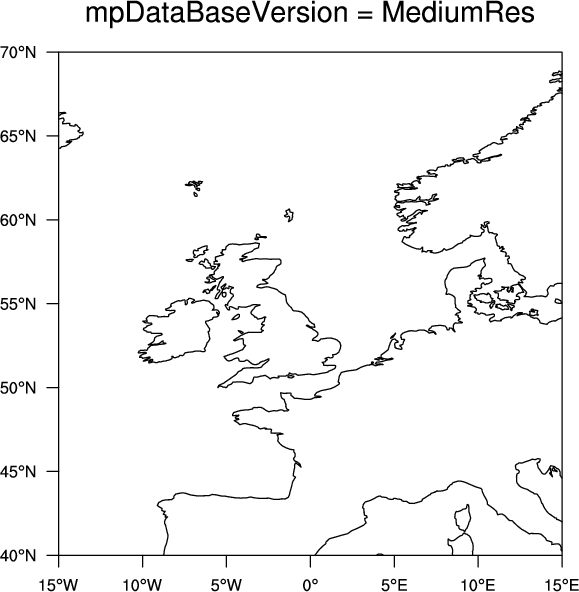
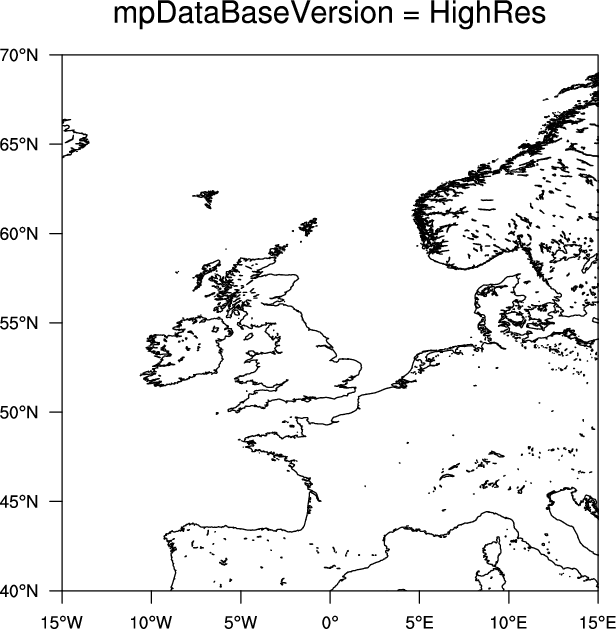
- Can I improve the resolution of my map outlines?
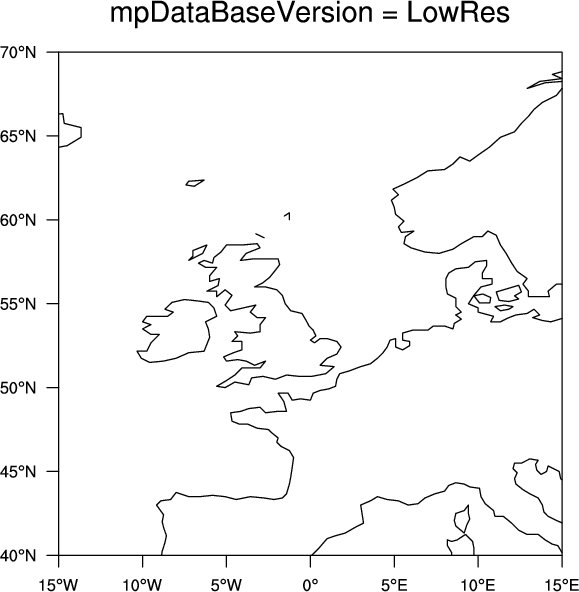
Yes, by using the mpDataBaseVersion resource. The default is "LowRes". If you change this to "MediumRes" or "HighRes", you will improve the resolution of your map outlines.
For an example comparing the three levels of resolutions, see the script coast1.py and
frame 1 (low resolution)
frame 2 (medium resolution)
frame 3 (high resolution)
Note: the "HighRes" resource value is for coastal outlines only, and you must download the RANGS (Regionally Accessible Nested Global Shorelines) database, developed by Rainer Feistel from Wessel and Smith's GSHHS (Global Self-consistent Hierarchical High-resolution Shoreline) database. For more information on how and where to install the database, read the short section on high-resolution coastlines.
- If I am creating a color contour or vector plot, how do I select my
colors such that they are spread across my whole color map?
This is the default when using PyNGL (NCL users note that this is different from the default setting in that package). The colors in the current color table are spread evenly across the contour levels. If you want to turn this feature off set the resource nglSpreadColors to False. In that case the colors in the color table will be assigned to the contour levels by matching color indices with contour intervals.
For an example of where the default value of nglSpreadColors (True) takes effect, see the fourth frame of ngl02p.py. For an example of setting this resource to False, see the first frame of ngl08p.py.
If you want to reverse the colors, then you can set nglSpreadColorStart to a color index towards the end of the color table, and nglSpreadColorEnd to a color index near the beginning of the color table. For an example, see seam.py and its first frame.
- How do I get multiple scales on my XY or contour plot?
Set one of the tm*Mode resources to Explicit (depending on which axis you want to label separately) and then use tm*Values and tm*Labels resources to get the labels that you want at whatever tick mark values you want them. For an example, see "multi_y.py" and its third frame.
For an example of different scales on a contour plot, see the script "ngl11p.py" and its first frame.
- How can I have a double quote (") appear as part of a text
string in PyNGL?
Enclose the string in single quotes. For example:
import Ngl

wks = Ngl.open_wks("x11","test")

txres = Ngl.Resources()
txres.txFontHeightF = 0.03
Ngl.text_ndc(wks,'"title"',0.5,0.5,txres)
Ngl.frame(wks)

Ngl.end()
- How can I have a new line as part of a text string in
PyNGL?
You can use the text function code that represents a carriage return ("C"):
import Ngl

wks = Ngl.open_wks("x11","test")

txres = Ngl.Resources()
txres.txFontHeightF = 0.03
Ngl.text_ndc(wks,"title1~C~title2~C~title3~C~title4",0.5,0.5,txres)
Ngl.frame(wks)

Ngl.end()
Note: The above example uses the tilde ("~") for the text function code. This is the default if you are using a standard implementation of PyNGL. See the question on changing the text function code for more information. - How can I draw to an X11 window and use
keyboard input for plotting control without having to do a mouse click?
See the example in the documentation for Ngl.clear_workstation.
- How come I get different line thicknesses on different output devices using the same thickness value?
Line thicknesses displayed on different output devices (X11, PostScript, PDF, etc.) can be significantly different for the same line thickness value. This is due to several factors.
Every device has a default, or nominal, line thickness (also sometimes call line width). This nominal line width is the width of a line drawn with the default thickness value of 1.0. In general this nominal line width is different for different devices. What a given device considers its default line width can vary from barely visible to fat. For example, the nominal line width for PostScript output may look thinner than a line drawn with the same width specification on an X11 window. Also, the results for X11 output can vary depending on the resolution of the output device.
The linewidth scale factor is applied to the nominal line width on a given device. However, it will not necessarily produce lines that are exactly that factor bigger than the default width. In fact the scale factor may have no effect, or unexpected effects. In general the scale factor is applied to the default line width of the device and maps onto the nearest available hardware line width that a device supports. For printed PostScript output the results you get will probably be as accurate as you will want, but for X11 output, or PostScript displayed on a computer monitor, you will get varying results.
Different devices also interpret fractional, or zero, line widths differently. For example, PostScript and PDF will always produce a line, no matter how small the line width value is - a zero linewidth value will produce a line one pixel wide. However, for X11 output any line width value less than 0.5 will usually map to a zero-width line, that being the closest available hardware line width. In contrast to PS or PDF, a zero-width line in X11 output is not drawn.
If you are trying to "zero" out a line, the recommendation is to do it some other way than setting the line thickness to 0. For example, you can draw it in the background color. This way you will get the same results for X11 and PostScript.
The bottom line is that you should not be surprised by what you get when it comes to line widths - it definitely depends on the output device.
The example thickness.py can be run to get an idea what various lines drawn with different thickness specifications will look like on different devices. In that example you will need to change the output device if you are interested in results other than for PostScript.
Post-processing questions
- How do I convert my PyNGL graphics file to another format,
like GIF or PNG, to put on the web?
We used to recommend using a script called "ncgm2gif" for converting NCGMs to GIF files. However, "ncgm2gif" has become a bit outdated, and there are better methods for converting to other raster formats.
Our recommendation is to start with a PostScript (PS) or Encapsulated PostScript (EPS) file, and then use "convert" from the ImageMagick suite of tools to convert the PS file to another format like GIF, PNG, or even MPEG.
You can get the ImageMagick suite from:
http://www.imagemagick.org/
Click on the "download" link on the left side and you will be presented with lots of options for download locations.Mac users can download it using "fink install imagemagick". You must have fink installed first - http://fink.sourceforge.net/.
Once you have the tools built and installed, you can convert your PS or PDF files to other formats using:
    convert -trim file.ps file.png
    convert -trim file.pdf file.png
We like to use the "-trim" option to remove unwanted white space around the image. This cuts it pretty close, so if you put it in a PowerPoint presentation, it is better to use a pure white background so the cropped image doesn't look funny.Documentation on "convert" can be found at:
http://www.imagemagick.org/script/convert.php
There are lots of options available with convert, that, according to their web page, allow you to "resize an image, blur, crop, despeckle, dither, draw on, flip, join, re-sample, and much more." - How do I convert my multi-frame NCGM file
to individual PNG files?
Download the Python script ncgm2png. Executing that script without any arguments will produce usage information. To work, this script requires that you have convert from the ImageMagick package installed as well as ctrans and med from the PyNGL distribution.
- How do I convert my multi-frame PostScript file
to individual PNG files?
Download the Python script ps2png. Executing that script without any arguments will produce usage information. To work, this script requires that you have convert from the ImageMagick package installed as well as psplit from the PyNGL distribution.
- If I obscure a PyNGL X11 window with another application, the
window doesn't refresh.
This is possibly due to an X11 backing store problem. If you run the command:
xdpyinfo | grep backing
and the output is similar to:options: backing-store NO, save-unders NO
then you will need to enable backing store in your X server configuration.There are different ways to do this, depending on what kind of system you're on. On a Linux system, try inserting the line:
Option "backingstore"
in the Device section of your X server configuration file (normally /etc/X11/XF86Config or /etc/X11/XF86Config-4). Alternatively, you can run your X server with the option "+bs" to obtain the same result without editing your configuration file. Restart your X server, then run the xdpyinfo command again to verify that backing store is now enabled.On a PC running Hummingbird, run Exceed's "xconfig" program. In the xconfig menu, double-click on "Performance". Make sure "Save Unders" is checked, set "Maximum Backing Store" to "Always", set "Default Backing Store" to "When Mapped", and set "Minimum Backing Store" to "When Mapped".
Documentation questions
- Where can I see a list of all the PyNGL resources?
Go to the URL:
http://www.pyngl.ucar.edu/Resources/
- Where can I see a list of all the PyNGL functions?
Go to function listings, available alphabetically or by category.
- Where can I see some examples of how to use PyNGL?
Go to the PyNGL example scripts.