
PyNGL > tutorial examples > 1 | 2 | 3 | 4 | 5 | 6 | 7 | 8 | 9 | 10 | 11
Example 9 - animated contours over a map
This example reads data from a netCDF file and creates a 12-frame animation of contours over a polar stereographic map projection.This example also makes use of a resource file (ngl09p.res) to set various resources. You should be careful in your use of resource files because you may forget about having written them and wind up not understanding the behavior that is being controlled by them behind the scenes.
To run this example, you must have the MA module from the Numerical Python package installed in your Python implementation. Numerical Python (also known as "NumPy") is a Python module allowing for efficient array processing. The MA module (masked array module) subsumes NumPy and allows for the automatic handling of arrays with missing or invalid values. All of the functionality of NumPy is available through the MA module. Usage of MA does slow things down quite a bit, so it should not be used when the basic NumPy module will do.
This example reads in a netCDF file, so you will need to have the Nio module (this module comes with PyNGL). netCDF is a self-documenting and network-transparent data format - see the netCDF User Guide for details.
There are two ways to run this example:
execute
pynglex ngl09p
or
download
ngl09p.pyand then type:
ngl09n.res
python ngl09p.py
Selected output from example 9
| Frame 1 (of 12) |
|---|
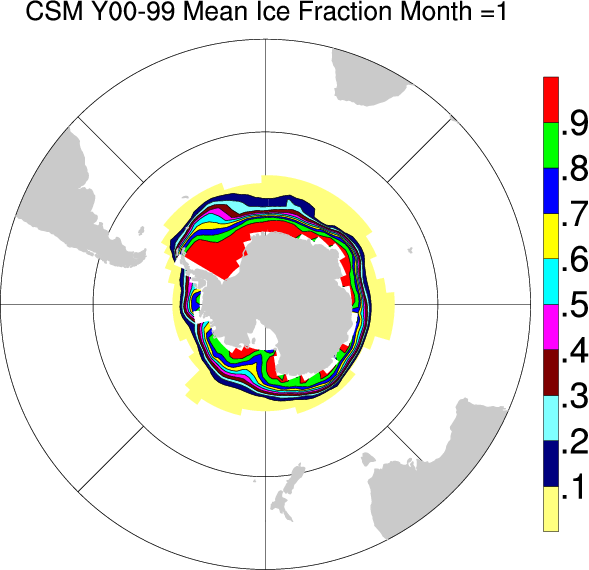
|
(Click on frame to see it enlarged.)
  0. #
  1. #  Import the masked array module from NumPy Python; import sys
  2. #
  3. import numpy, sys
  4. from numpy import ma as MA
  5.
  6. #
  7. #  Import Ngl support functions.
  8. #
  9. import Ngl
 10.
 11. #
 12. #  Import Nio.
 13. #
 14. import Nio
 15.
 16. #
 17. #  Open the netCDF files, get variables.
 18. #
 19. data_dir = Ngl.pynglpath("data")
 20. ice1     = Nio.open_file(data_dir + "/cdf/fice.nc","r")
 21.
 22. #
 23. #  Create a masked array to accommodate missing values in the fice variable.
 24. #
 25. fice = ice1.variables["fice"]  # fice[120,49,100]
 26. ficea = fice[:,:,:]
 27. fill_value = None
 28. if (hasattr(fice,"missing_value")):
 29.   fill_value = fice.missing_value
 30. elif (hasattr(fice,"_FillValue")):
 31.   fill_value = fice._FillVlaue
 32. fice_masked = MA.transpose(MA.masked_values(ficea,fill_value),(1,2,0))
 33.
 34. hlat = ice1.variables["hlat"]  # hlat[49]
 35. hlon = ice1.variables["hlon"]  # hlon[100]
 36.
 37.
 38. dimf     = fice.shape  # Define an array to hold long-term monthly means.
 39. ntime    = fice.shape[0]
 40. nhlat    = fice.shape[1]
 41. nhlon    = fice.shape[2]
 42.
 43. nmo    = 0
 44. month  = nmo+1
 45.
 46. icemon = MA.zeros((nhlat,nhlon),dtype=float)
 47. for i in xrange(fice_masked.shape[0]):
 48.   for j in xrange(fice_masked.shape[1]):
 49.     icemon[i,j] = MA.average(fice_masked[i,j,0:ntime:12])
 50.
 51. #
 52. #  Fill the places where icemon is zero with the fill value.
 53. #
 54. icemon = MA.masked_values(icemon,0.,rtol=0.,atol=1.e-15)
 55. icemon = MA.filled(icemon,value=fill_value)
 56.
 57.                        # Calculate the January (nmo=0) average.
 58.
 59.
 60. nsub = 16 # Subscript location of northernmost hlat to be plotted.
 61.
 62. cmap = numpy.array([                                         \
 63.          [1.00,1.00,1.00], [0.00,0.00,0.00], [1.00,1.00,0.50], \
 64.          [0.00,0.00,0.50], [0.50,1.00,1.00], [0.50,0.00,0.00], \
 65.          [1.00,0.00,1.00], [0.00,1.00,1.00], [1.00,1.00,0.00], \
 66.          [0.00,0.00,1.00], [0.00,1.00,0.00], [1.00,0.00,0.00], \
 67.          [0.50,0.00,1.00], [1.00,0.50,0.00], [0.00,0.50,1.00], \
 68.          [0.50,1.00,0.00], [0.50,0.00,0.50], [0.50,1.00,0.50], \
 69.          [1.00,0.50,1.00], [0.00,0.50,0.00], [0.50,0.50,1.00], \
 70.          [1.00,0.00,0.50], [0.50,0.50,0.00], [0.00,0.50,0.50], \
 71.          [1.00,0.50,0.50], [0.00,1.00,0.50], [0.50,0.50,0.50], \
 72.          [0.625,0.625,0.625] ],dtype=float)
 73.
 74. rlist = Ngl.Resources()
 75. rlist.wkColorMap = cmap
 76. wks_type = "ps"
 77. wks = Ngl.open_wks(wks_type,"ngl09p",rlist) # Open a workstation.
 78.
 79. resources = Ngl.Resources()
 80. resources.sfMissingValueV = fill_value
 81.
 82. icemonnew,hlonnew = Ngl.add_cyclic(icemon[0:nsub+1,:],hlon[:])
 83. resources.sfXArray = hlonnew   # Necessary for overlay on a map.
 84. resources.sfYArray = hlat[0:nsub+1]
 85. resources.nglSpreadColors = False    # Do not interpolate color space.
 86.
 87. resources.tiMainString = "CSM Y00-99 Mean Ice Fraction Month =" + str(month)
 88.
 89. resources.pmTickMarkDisplayMode = "Never"
 90.
 91. map = Ngl.contour_map(wks,icemonnew,resources) # Draw a contour
 92.                                                # over a map.
 93.
 94. nmos = 12    # Specify the number of months in the loop (max 120).
 95. for nmo in range(1,nmos):
 96.   month  = nmo+1
 97.   for i in xrange(fice_masked.shape[0]):
 98.     for j in xrange(fice_masked.shape[1]):
 99.       icemon[i,j] = MA.average(fice_masked[i,j,nmo:ntime:12])
100.   icemon = MA.masked_values(icemon,0.,rtol=0.,atol=1.e-15)
101.   icemon = MA.filled(icemon,value=fill_value)
102.
103.   resources.tiMainString = "CSM Y00-99 Mean Ice Fraction Month =" + str(month)
104.   map = \
105.     Ngl.contour_map(wks,Ngl.add_cyclic(icemon[0:nsub+1,:]),resources)
106.
107. del icemon       # Clean up.
108. del icemonnew
109. del map
110.
111. Ngl.end()
Explanation of example 9
Lines 3-4:
  import numpy, sys
  from numpy import ma as MA
Import the Masked Array module from the Numerical Python package. This module is imported for this example, since we will be processing on data with missing values. You must have this module installed in your Python implementation. The Python module sys will also be used in this example.
resources.nglSpreadColors = False # Do not interpolate color space.
The "spread colors" feature is turned off so that we get a one-to-one matching between color indices and contour levels.