PyNGL Graphical Gallery
Below is a gallery of all images produced by PyNGL examples.
Click on the smaller image for a larger one. The image title
link takes you to the source example that created the image;
that source has details on the example.
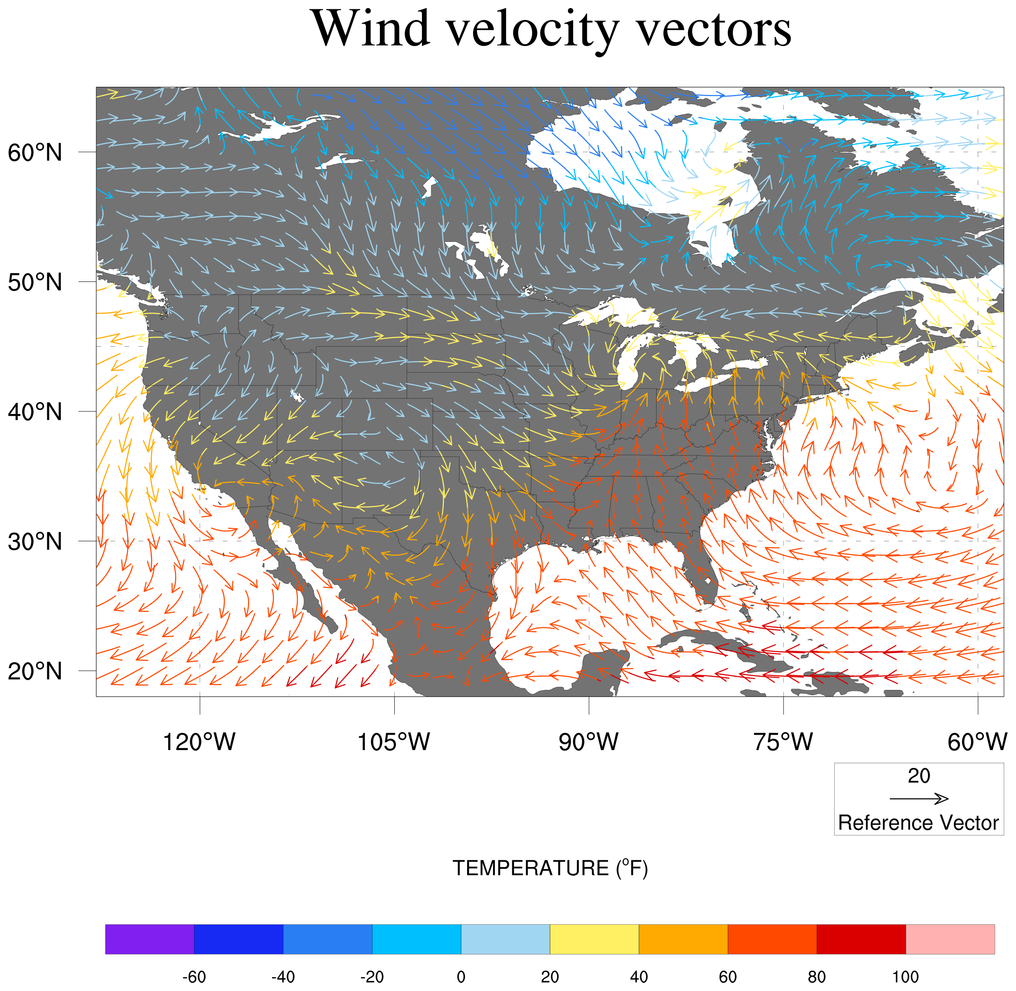
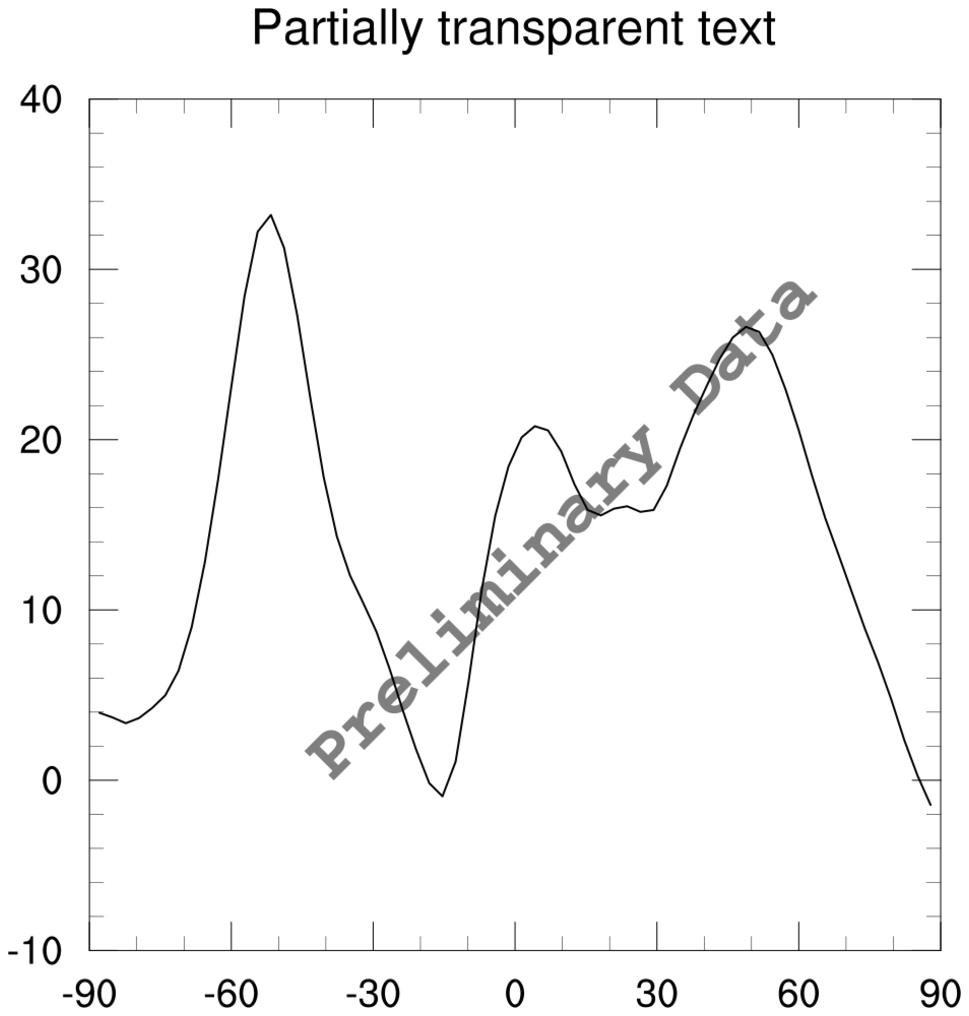
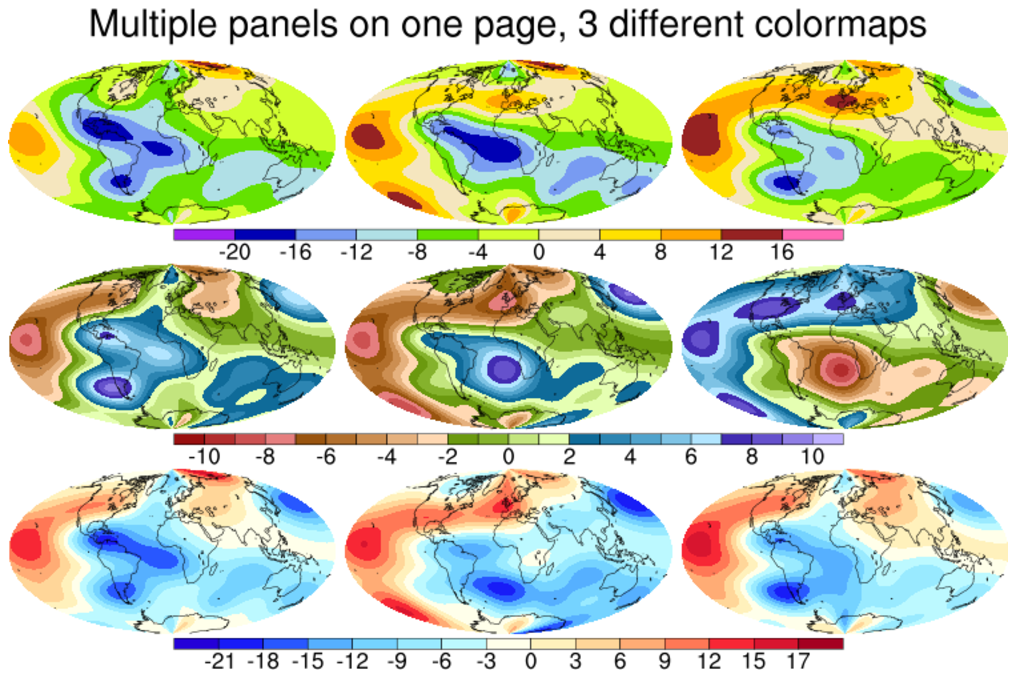
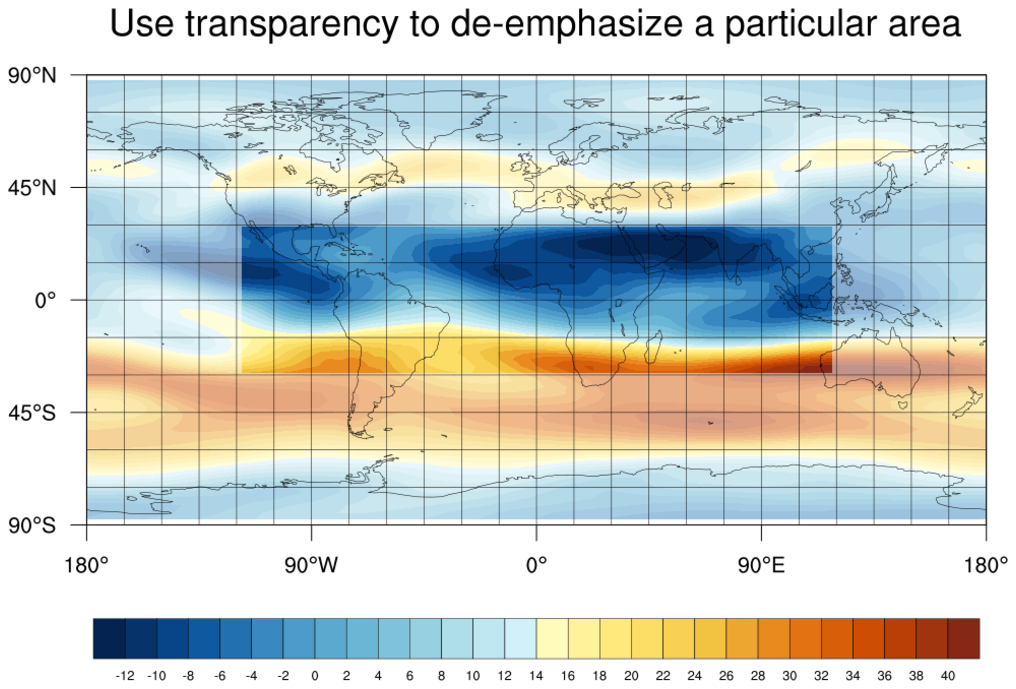
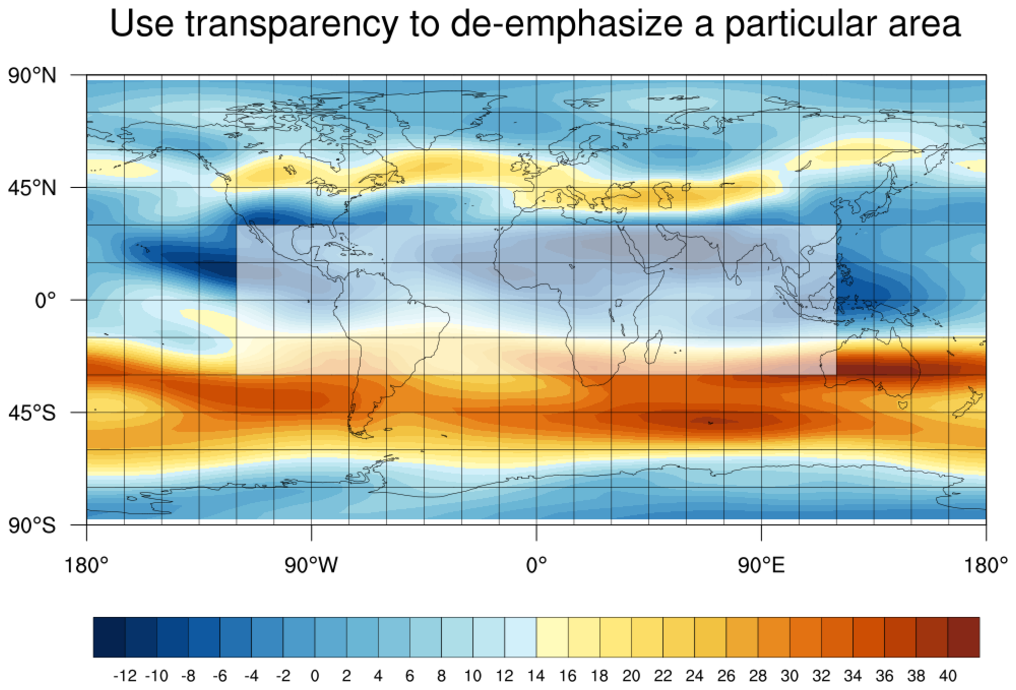
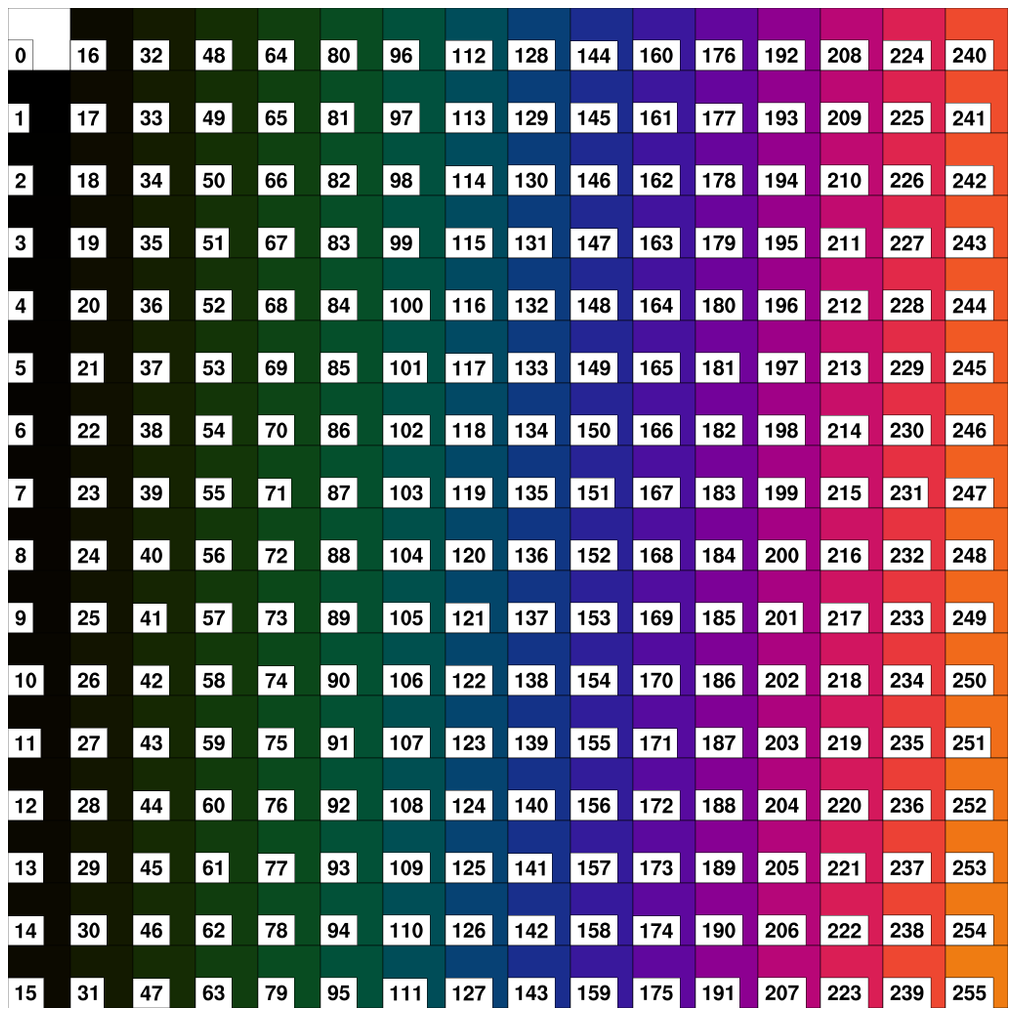
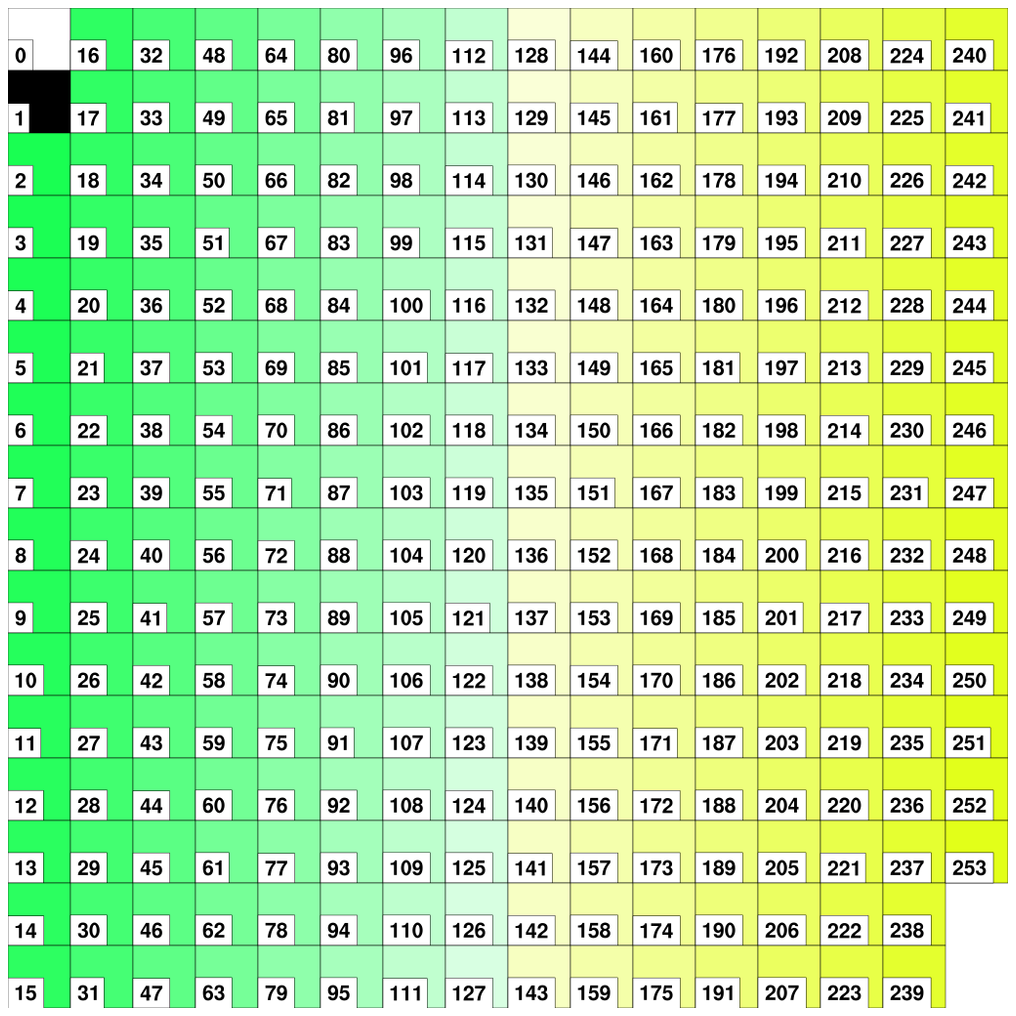
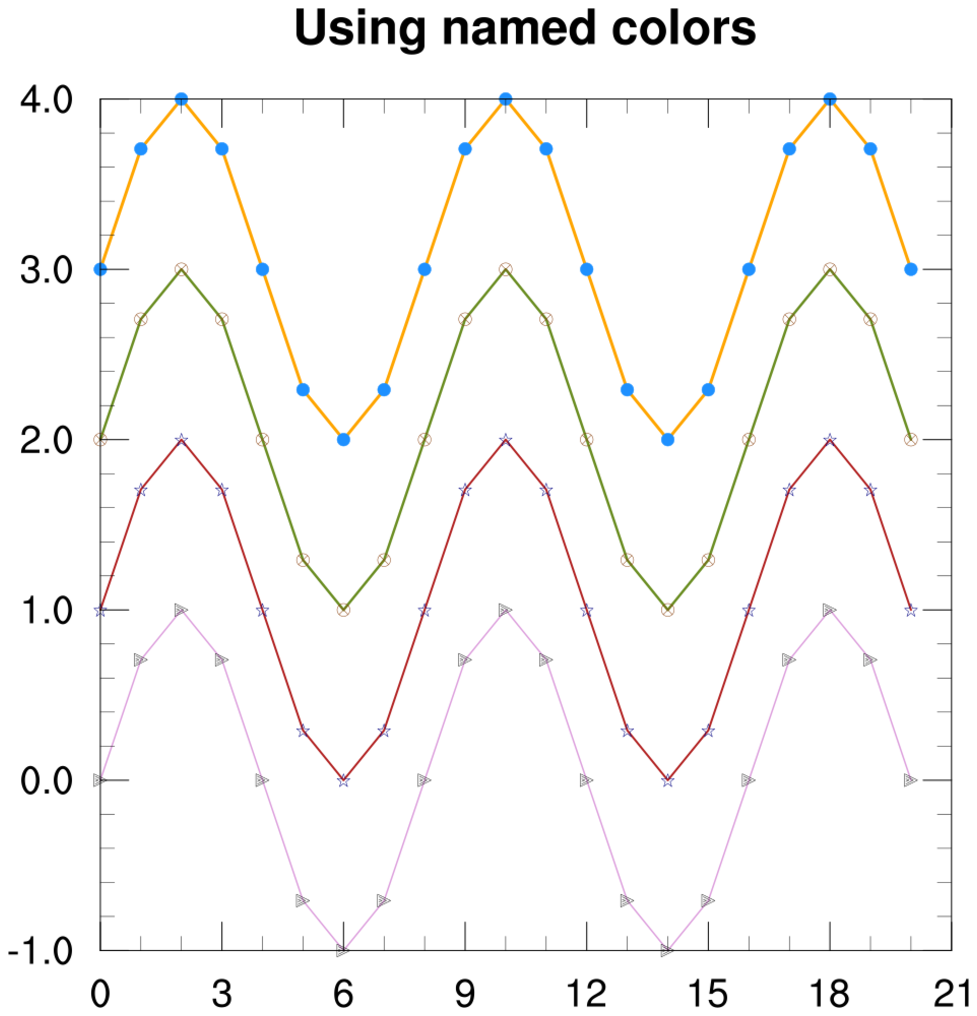
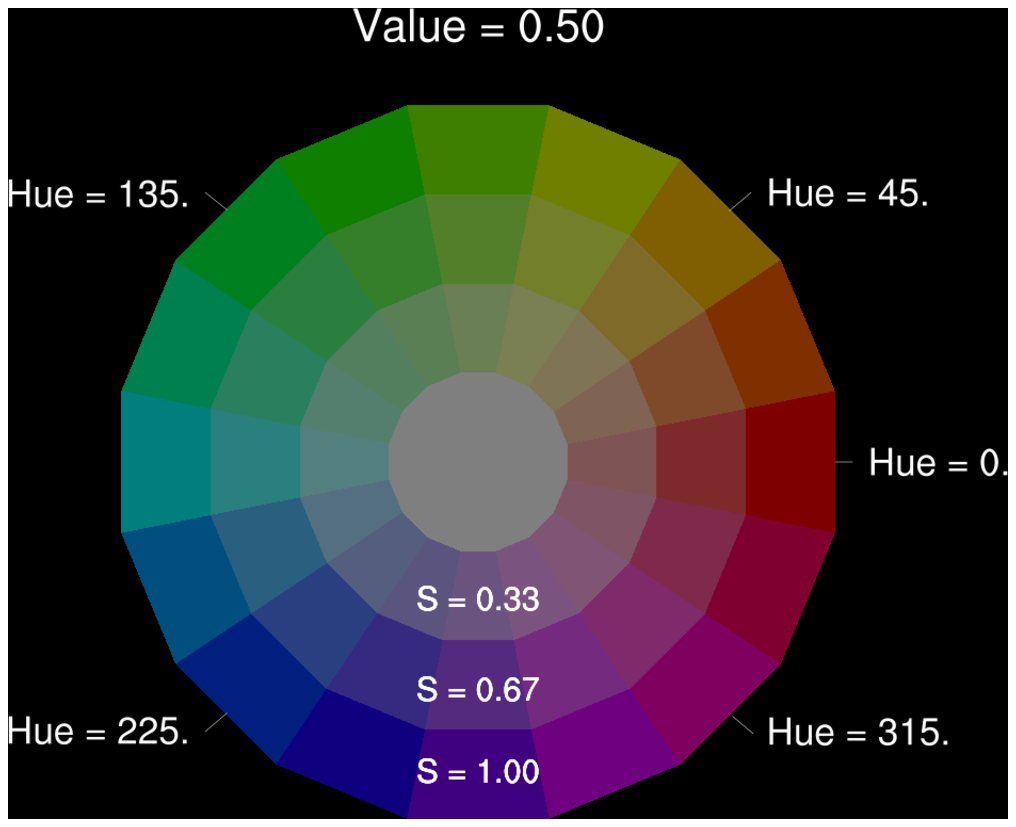
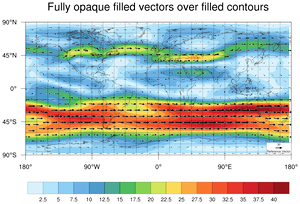
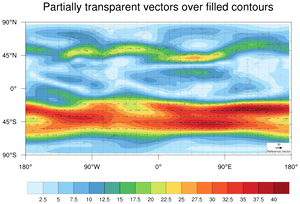
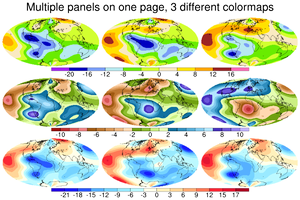
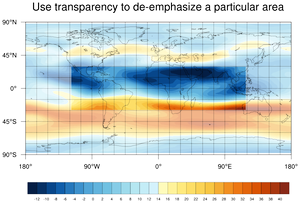
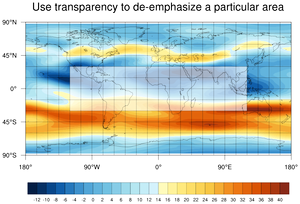
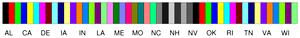
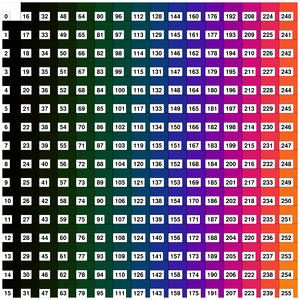
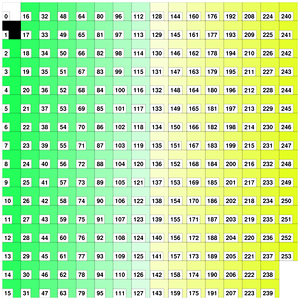
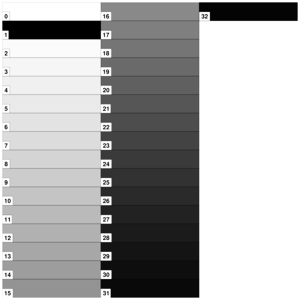
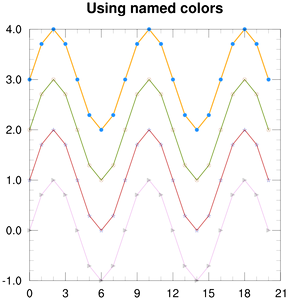
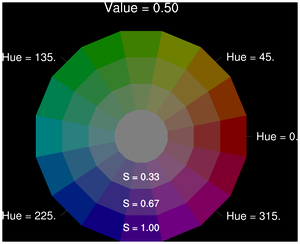
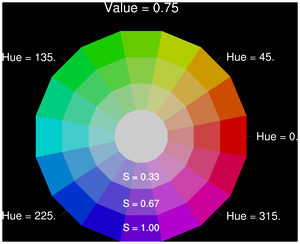
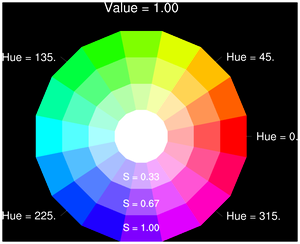
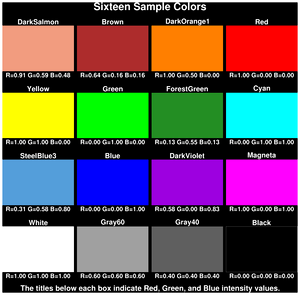
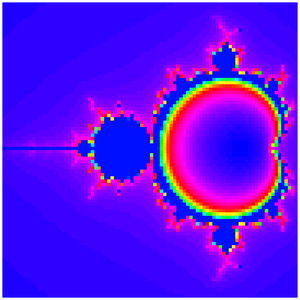
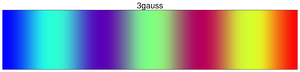
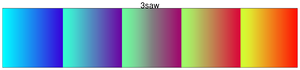
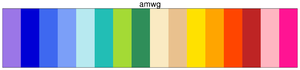
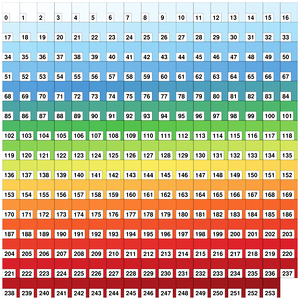
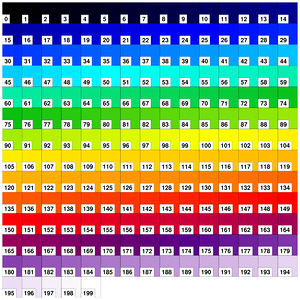
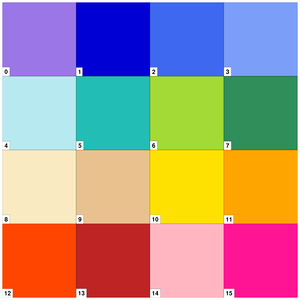
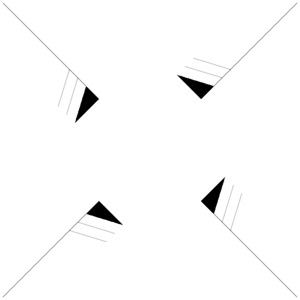
New color features added in PyNGL 1.5.0
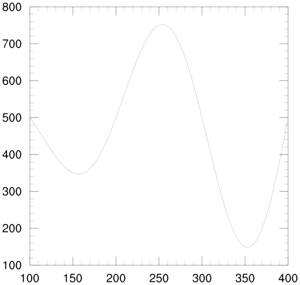
newcolor1.py
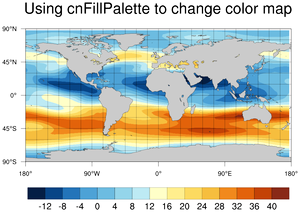
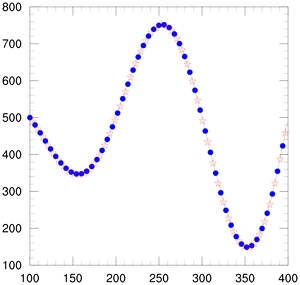
newcolor2.py
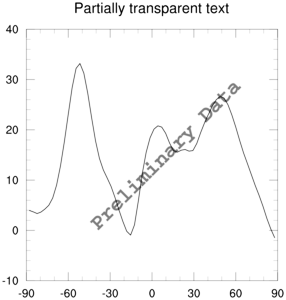
newcolor3.py
newcolor4.py
newcolor6.py
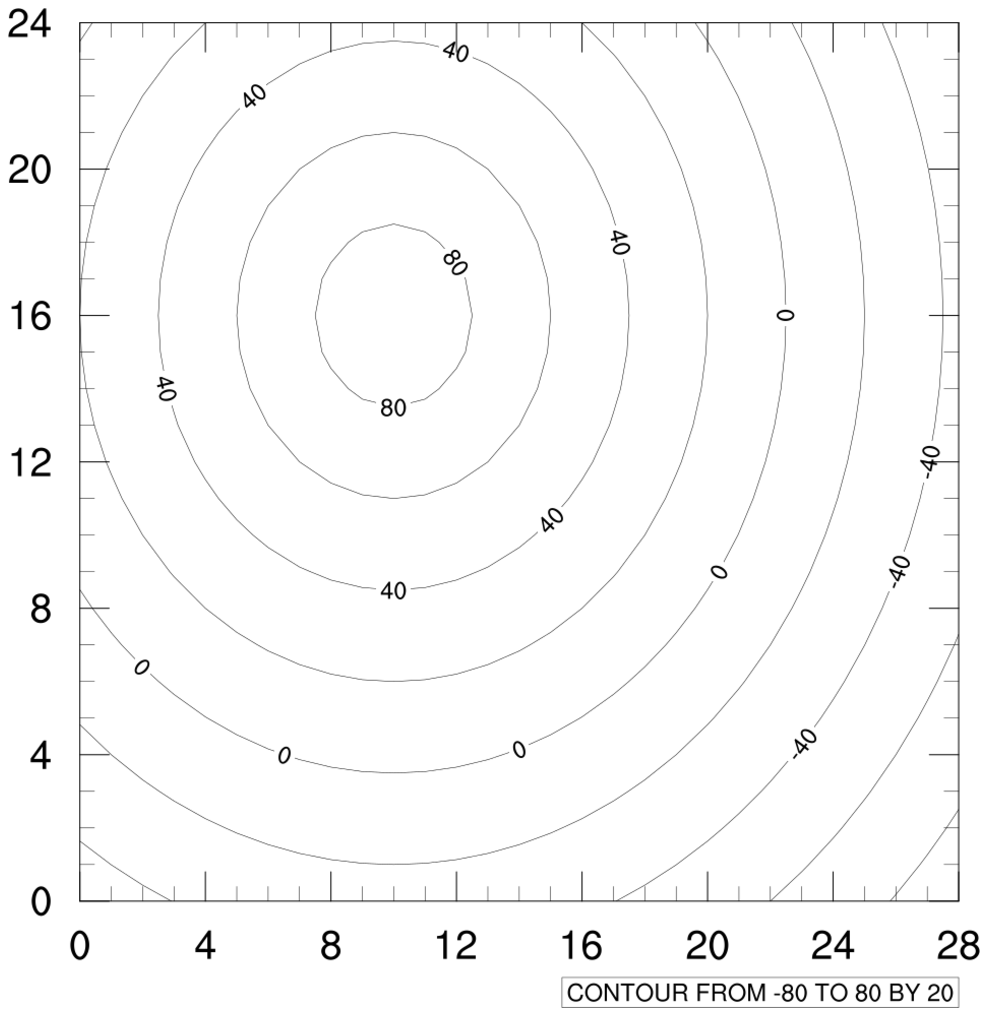
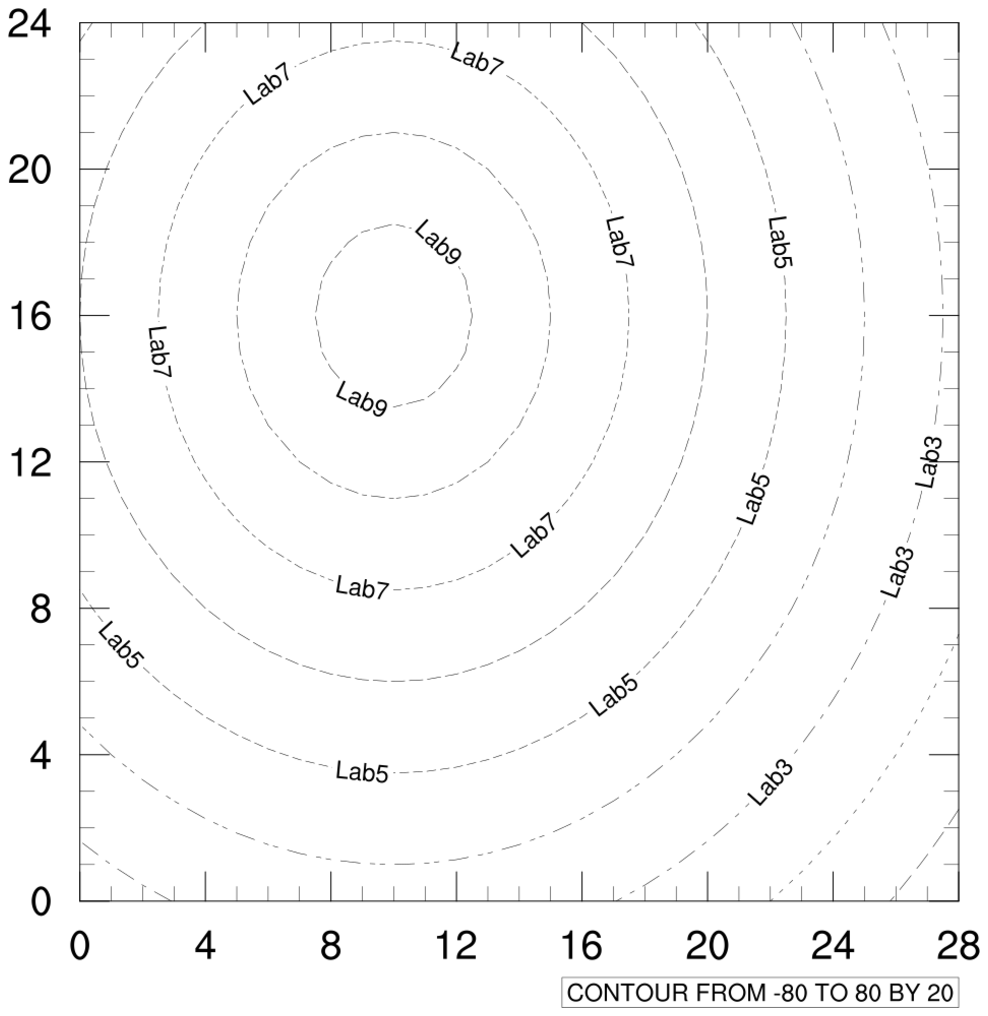
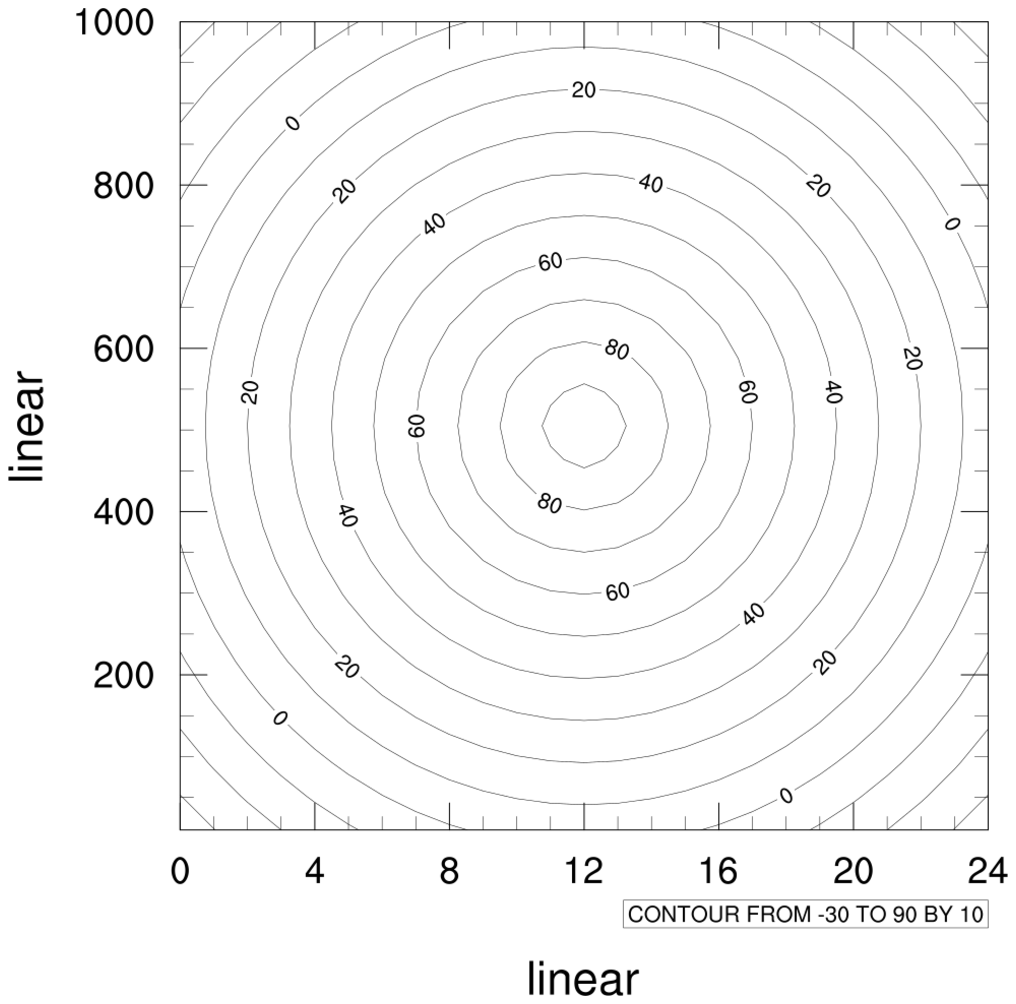
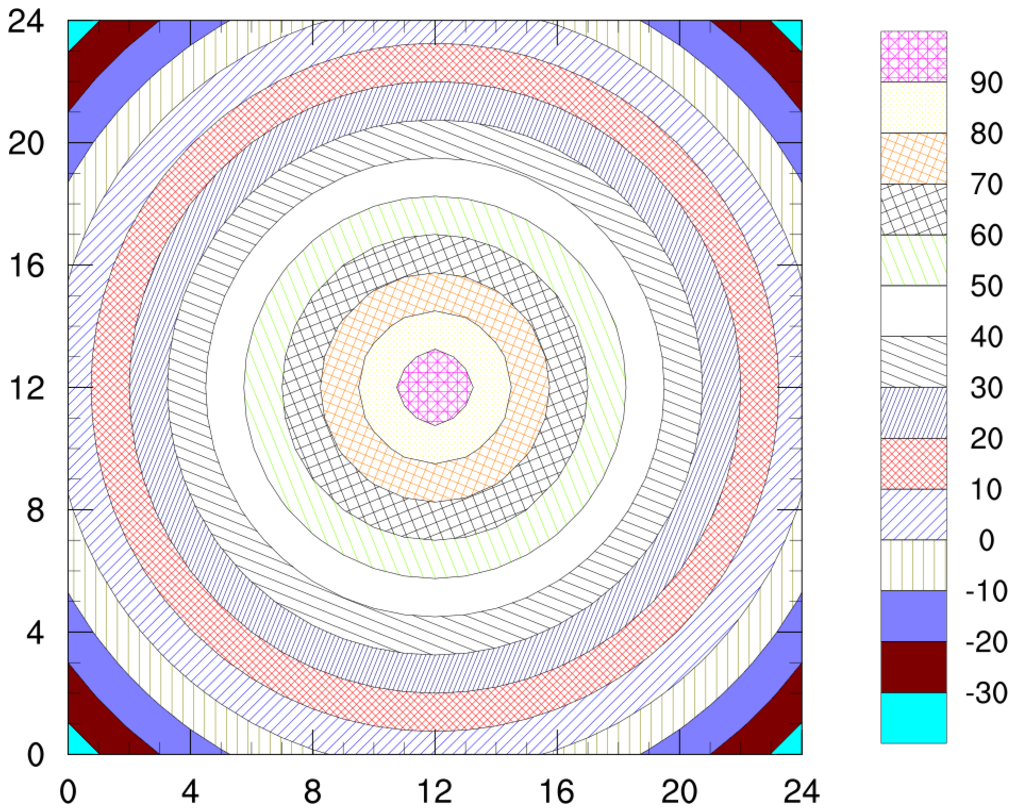
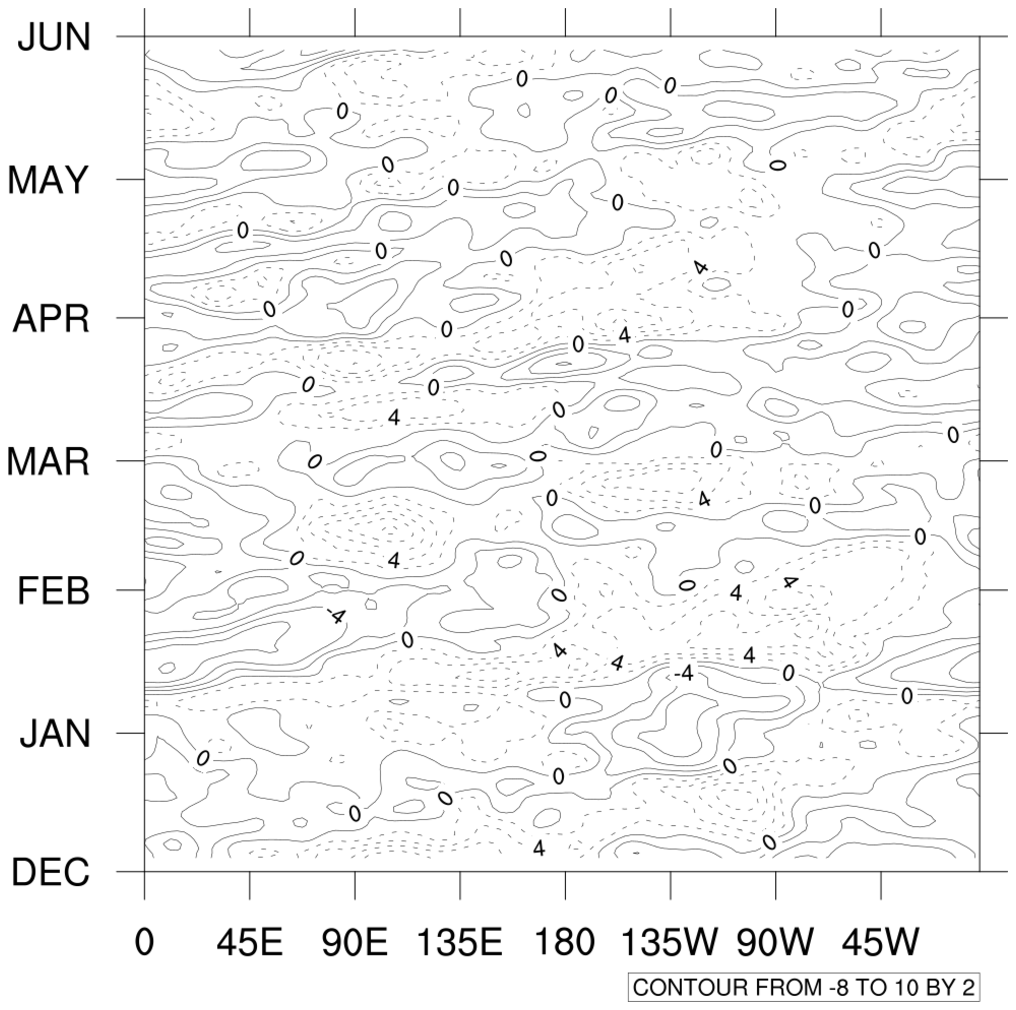
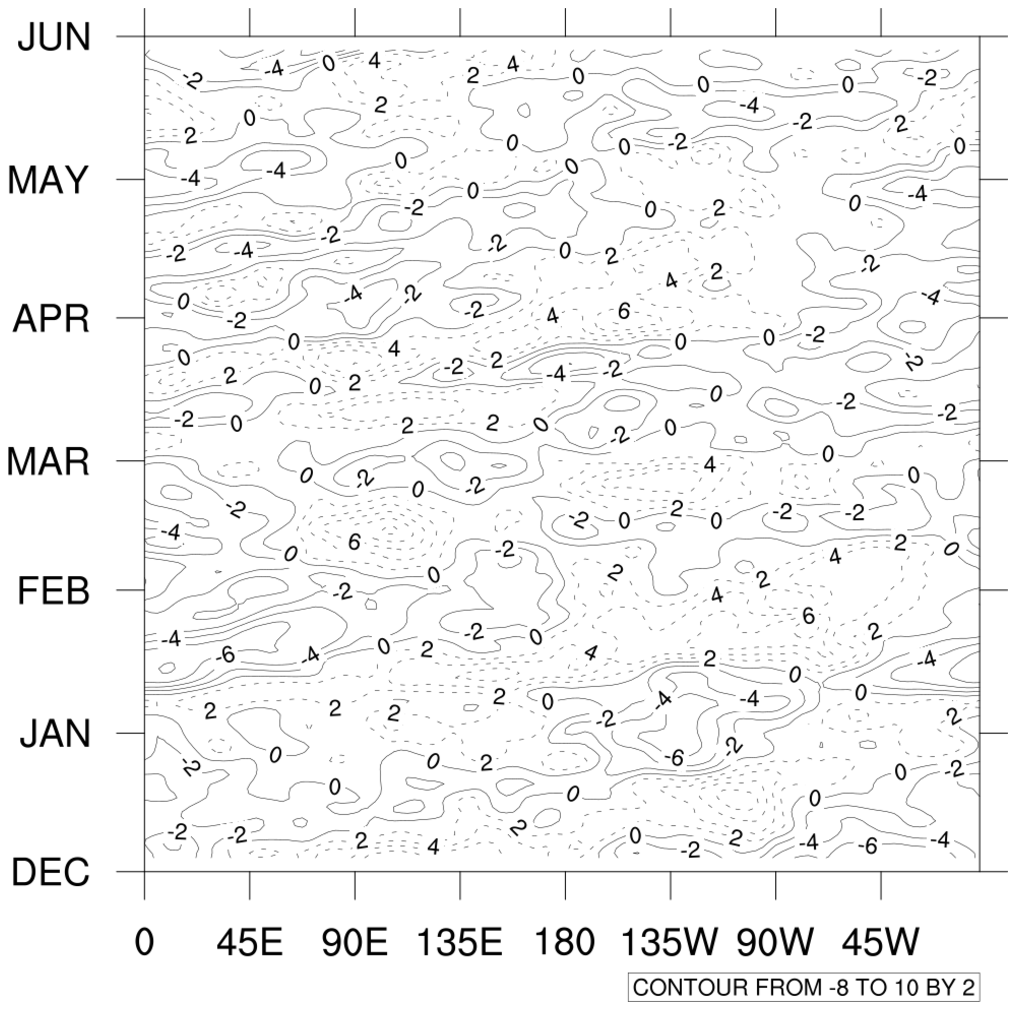
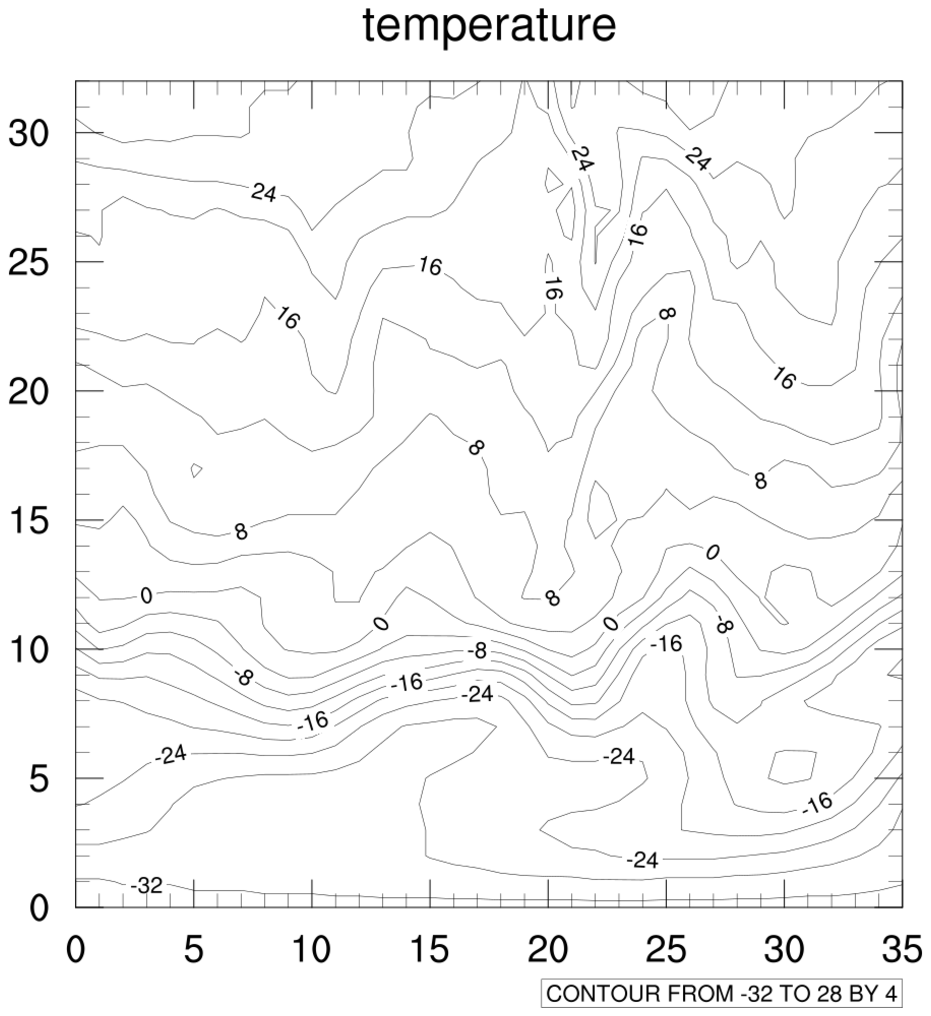
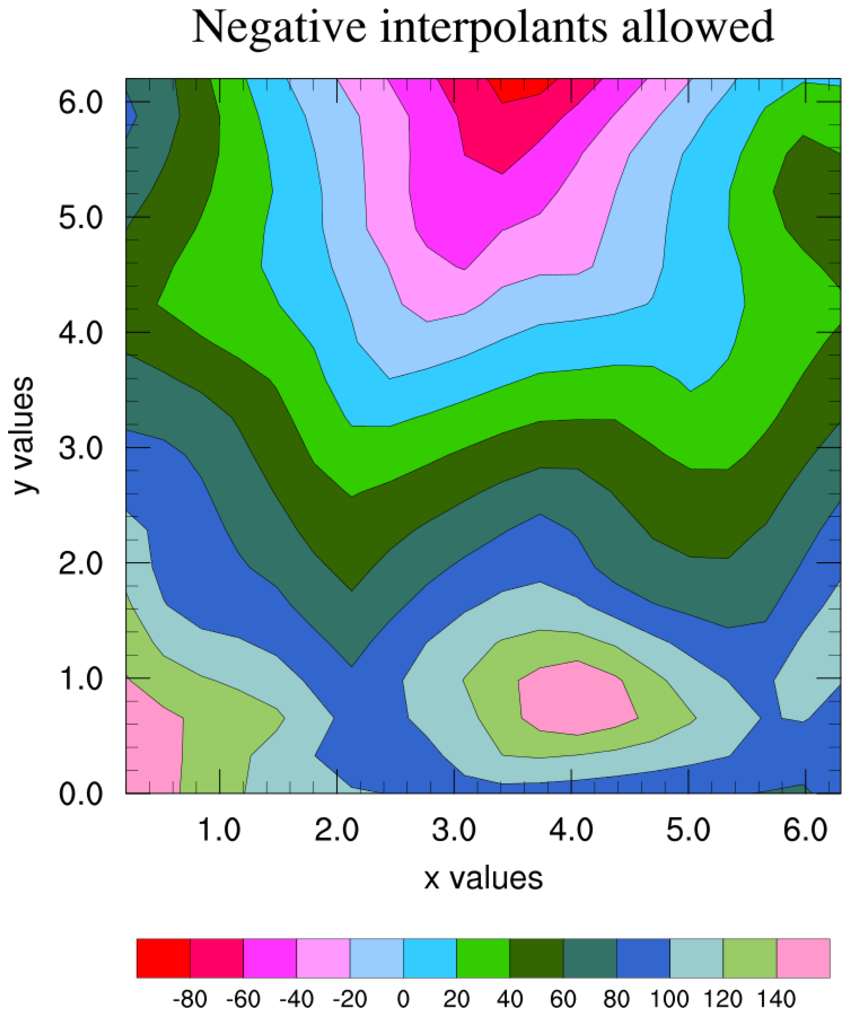
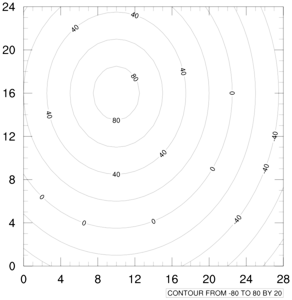
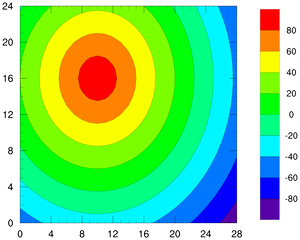
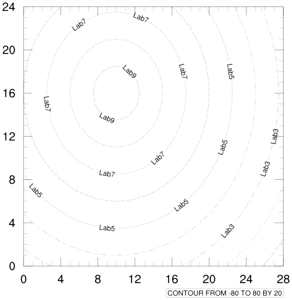
Basic contour plots
cn01p.py
cn02p.py
cns01p.py

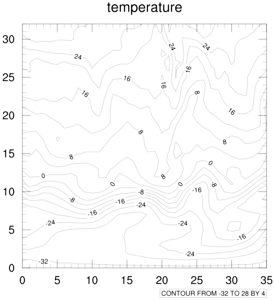
contour1.py
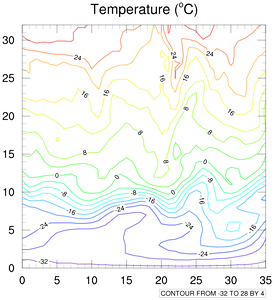
contour2.py
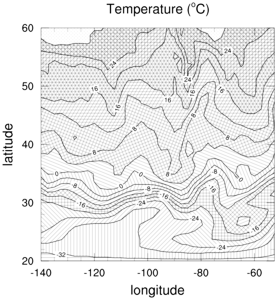
contour3.py
ngl02p.py
ngl08p.py
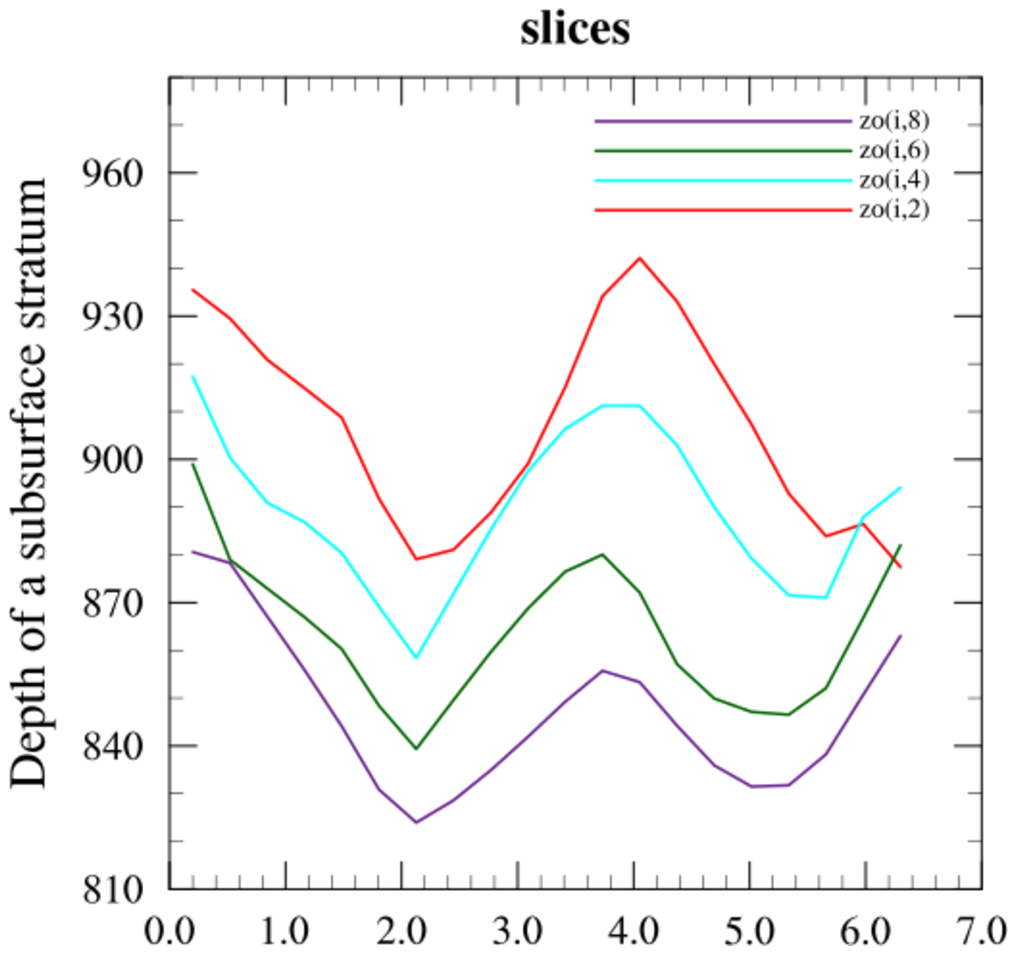
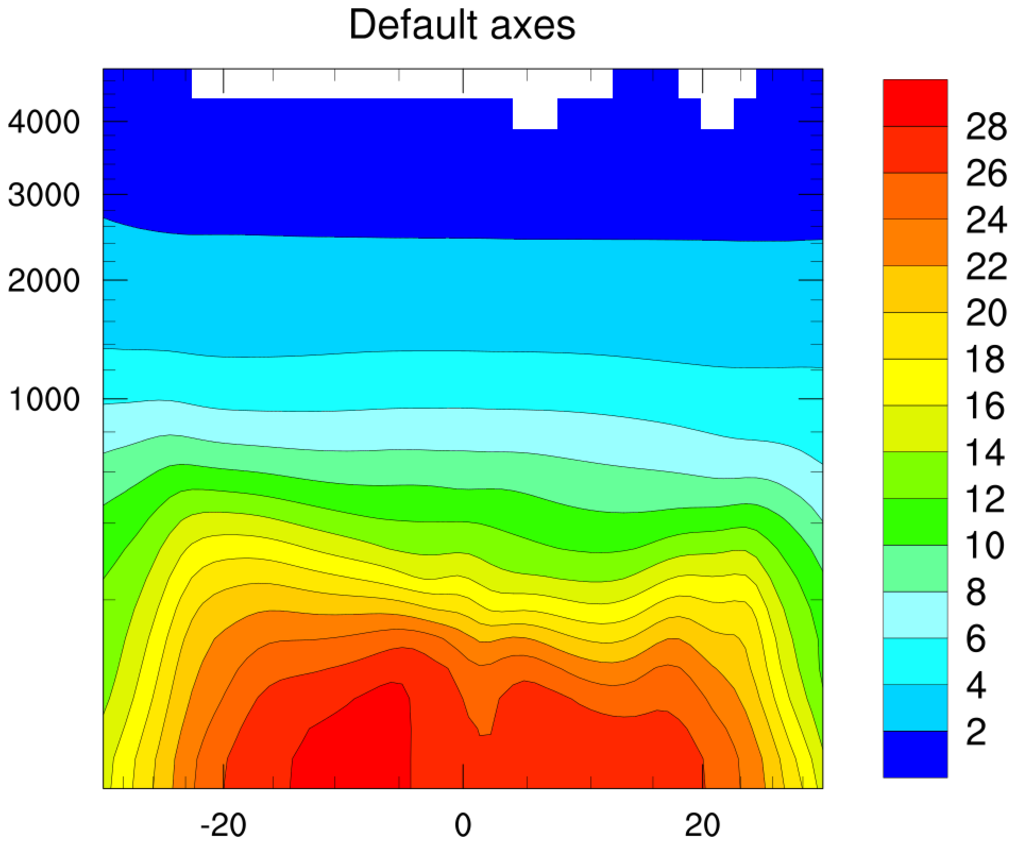
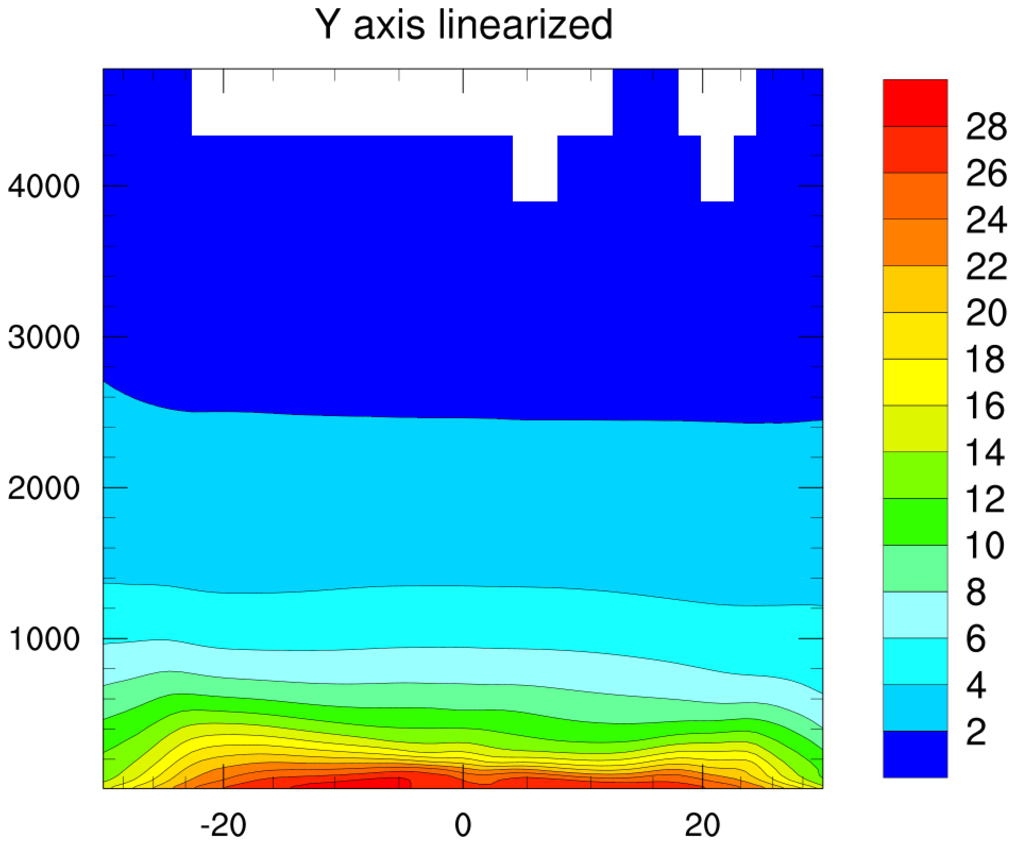
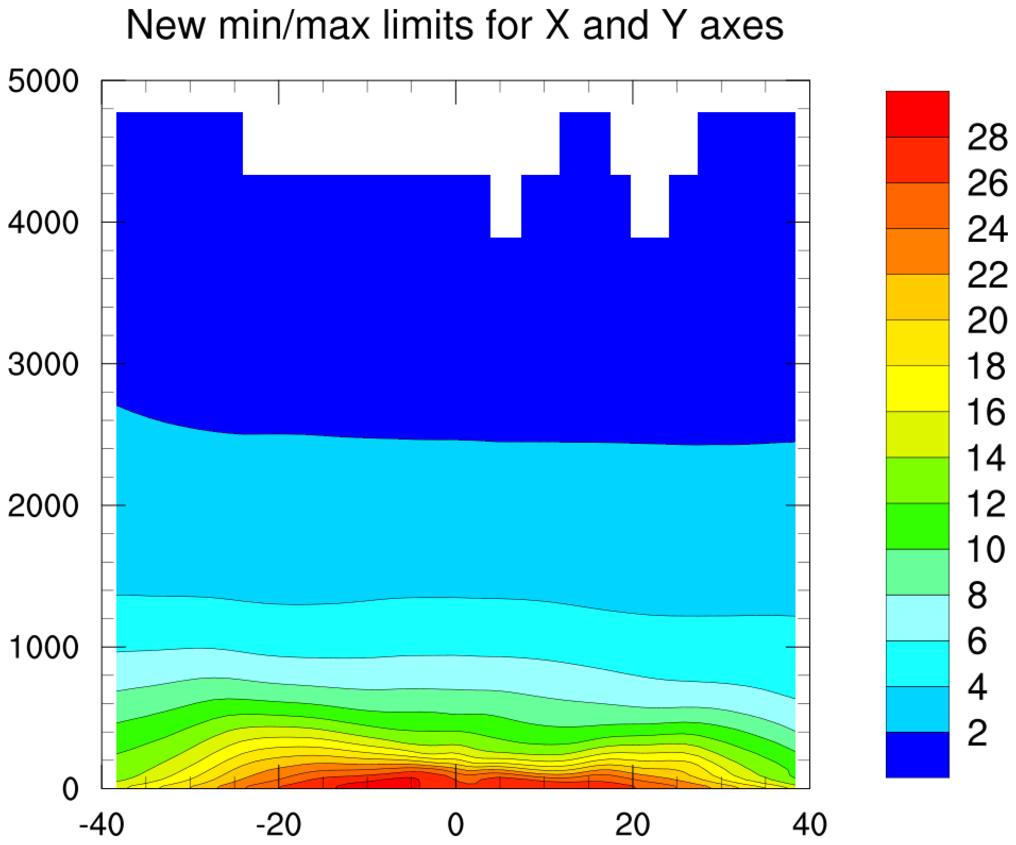
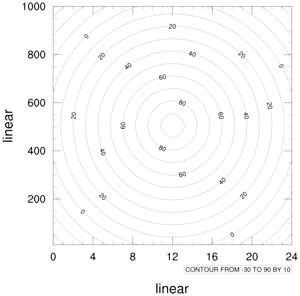
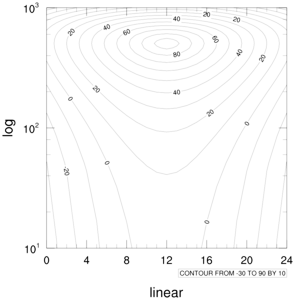
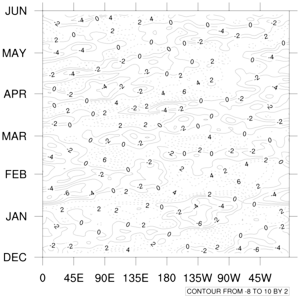
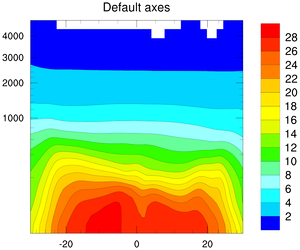
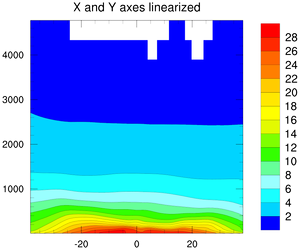
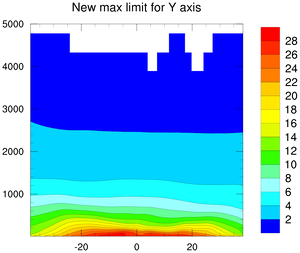
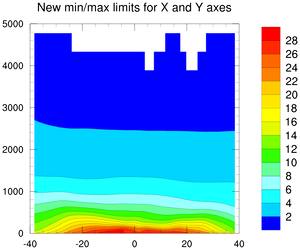
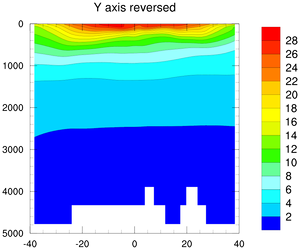
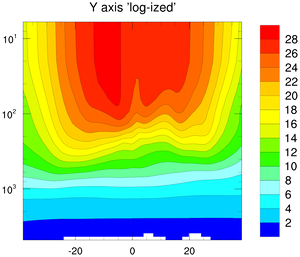
irregular.py

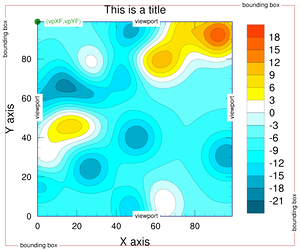
viewport1.py
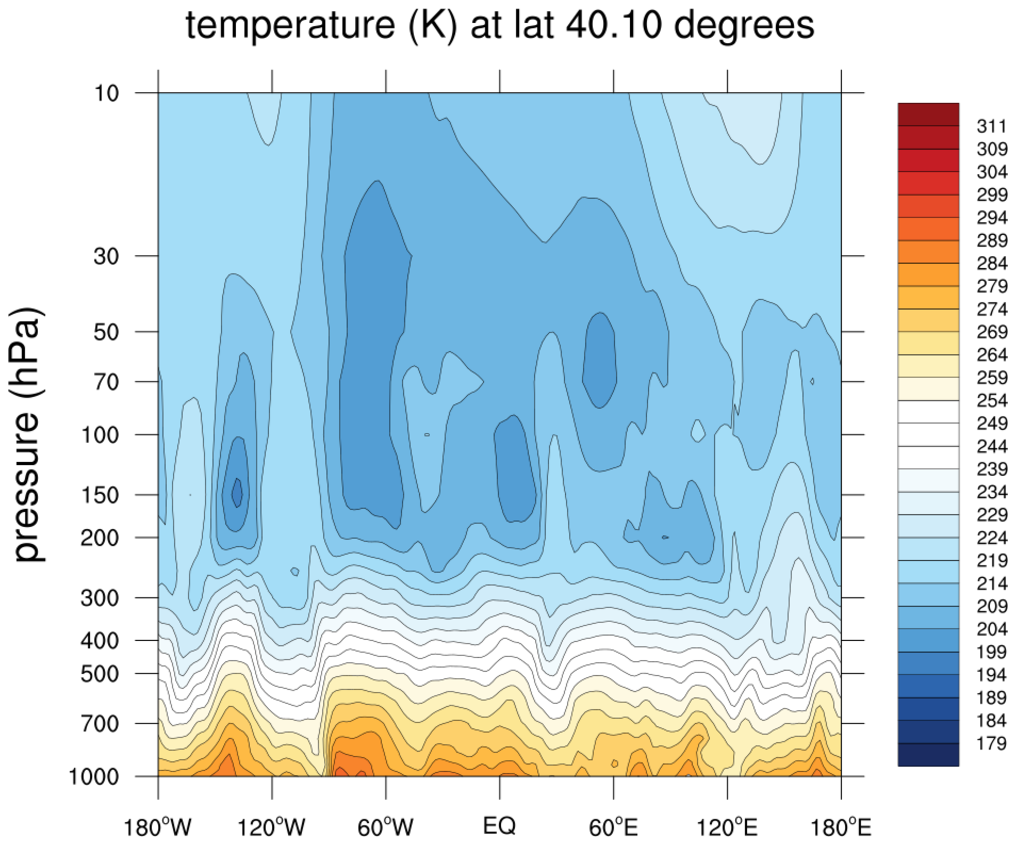
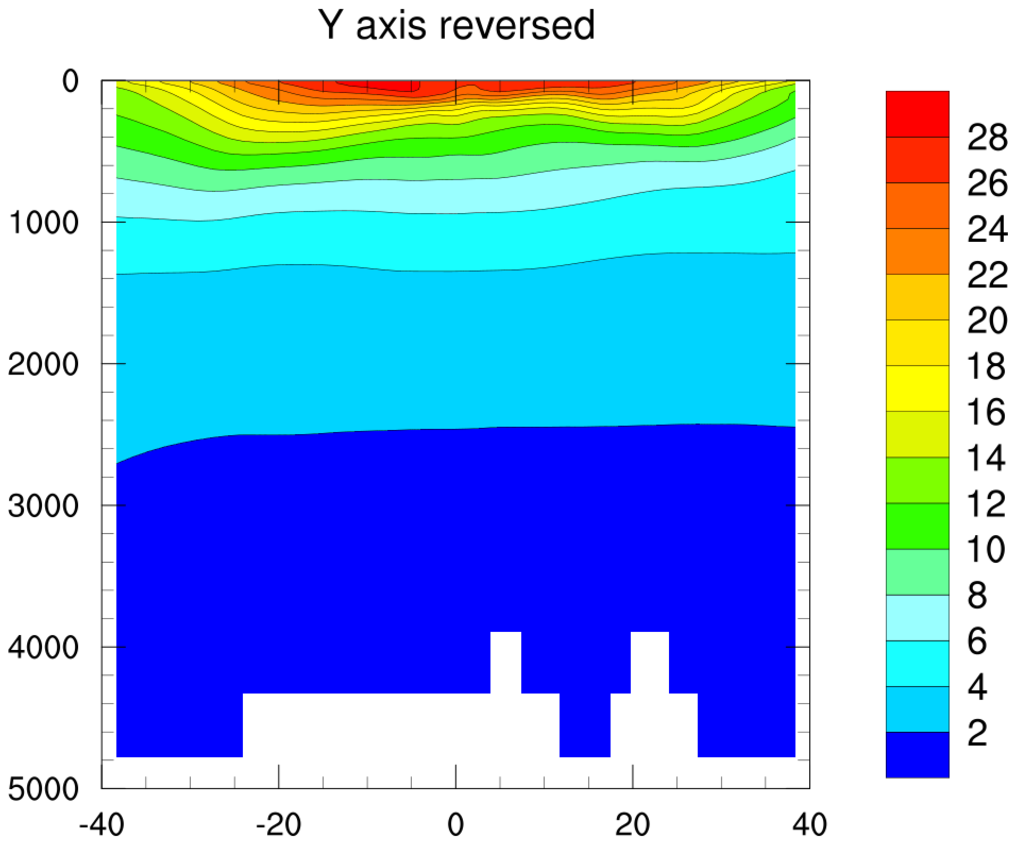
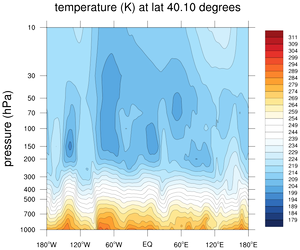
NUG_rectilinear_slice_PyNGL.py
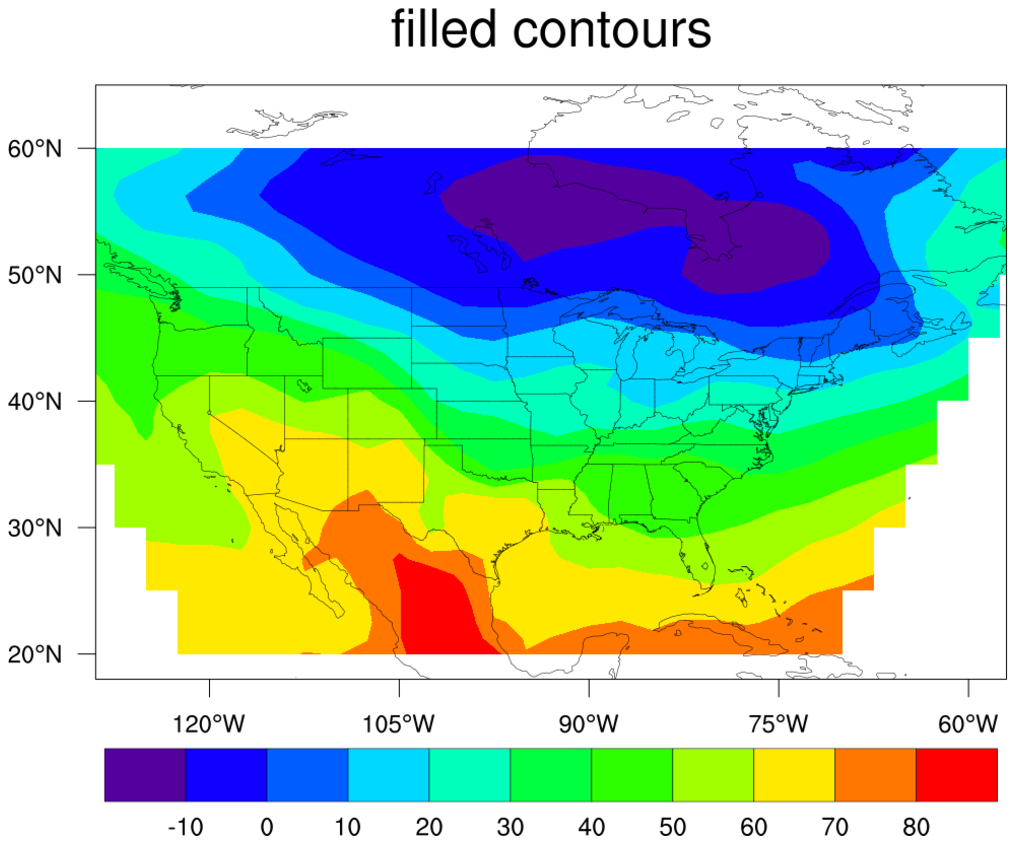
Contours over maps
cn05p.py
cn12p.py
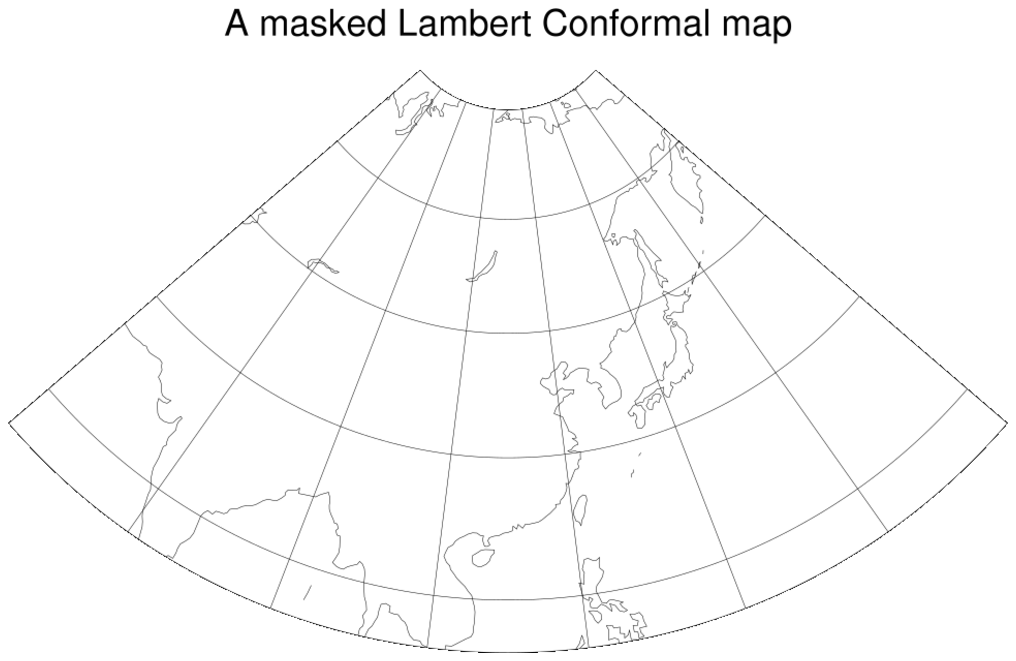
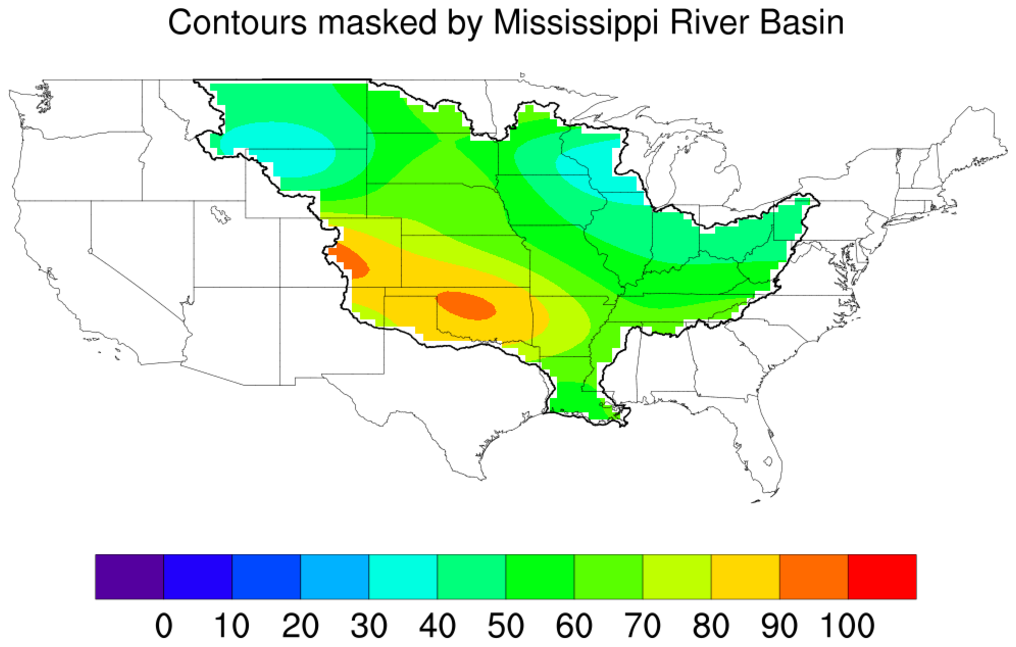
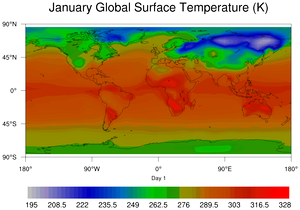
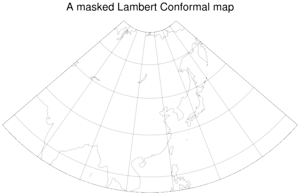
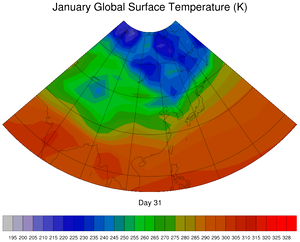
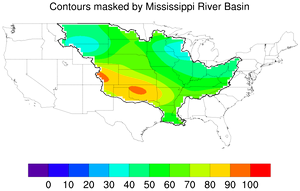
conmasklc.py
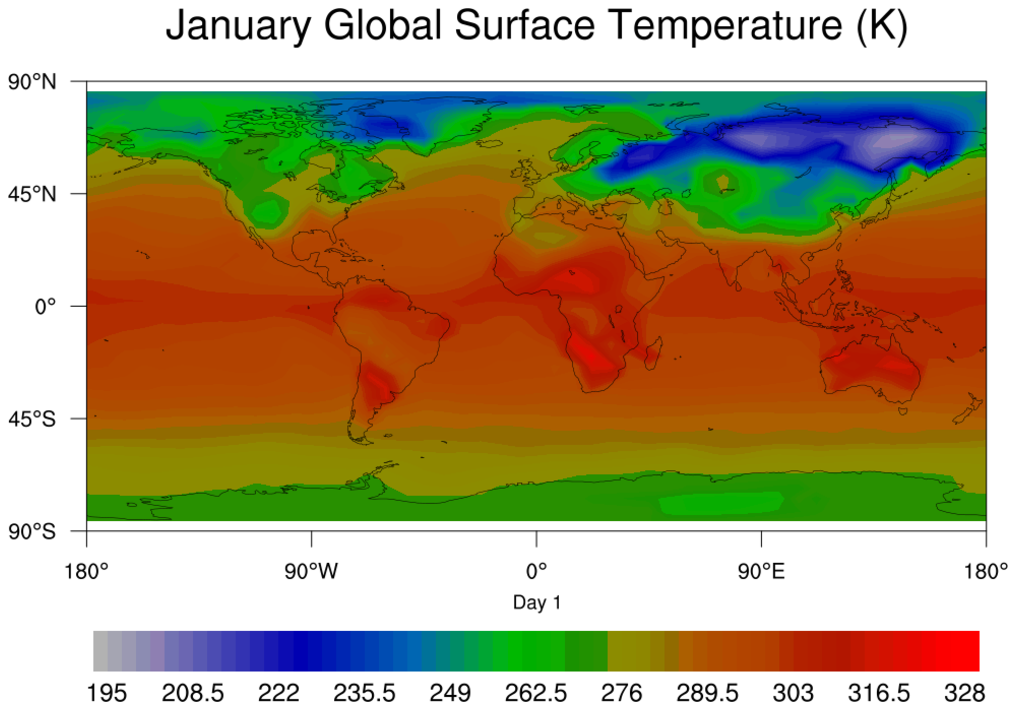
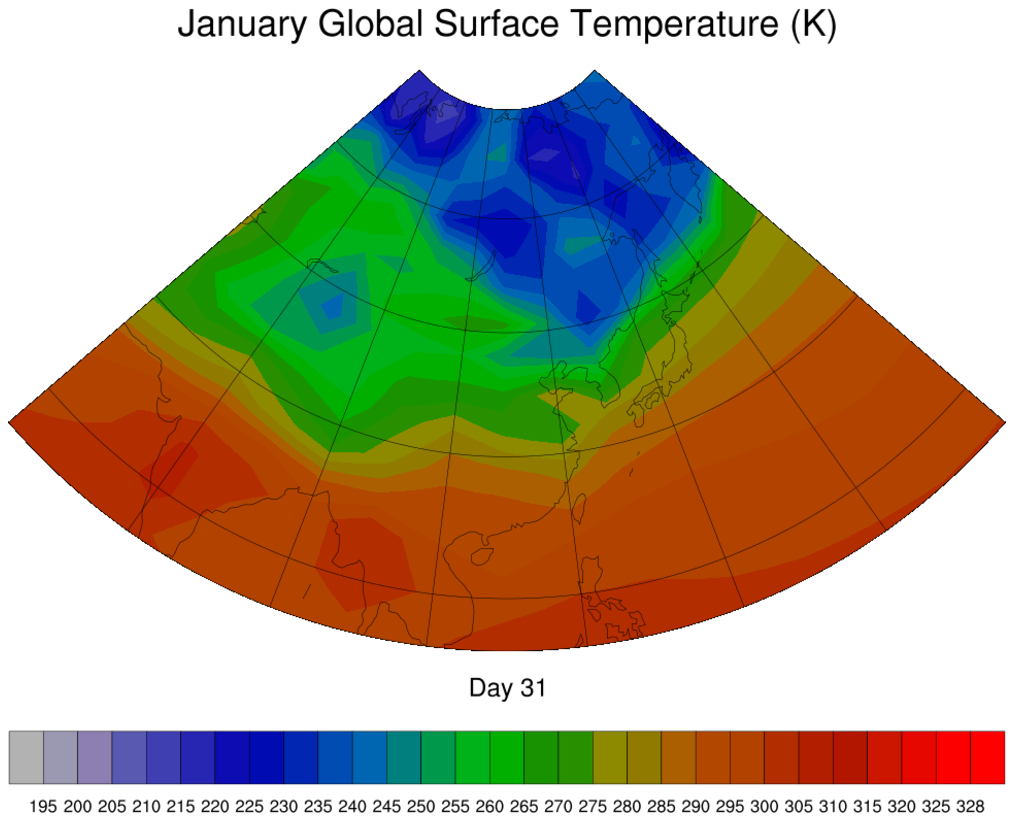
newcolor6.py
ngl05p.py
ngl09p.py
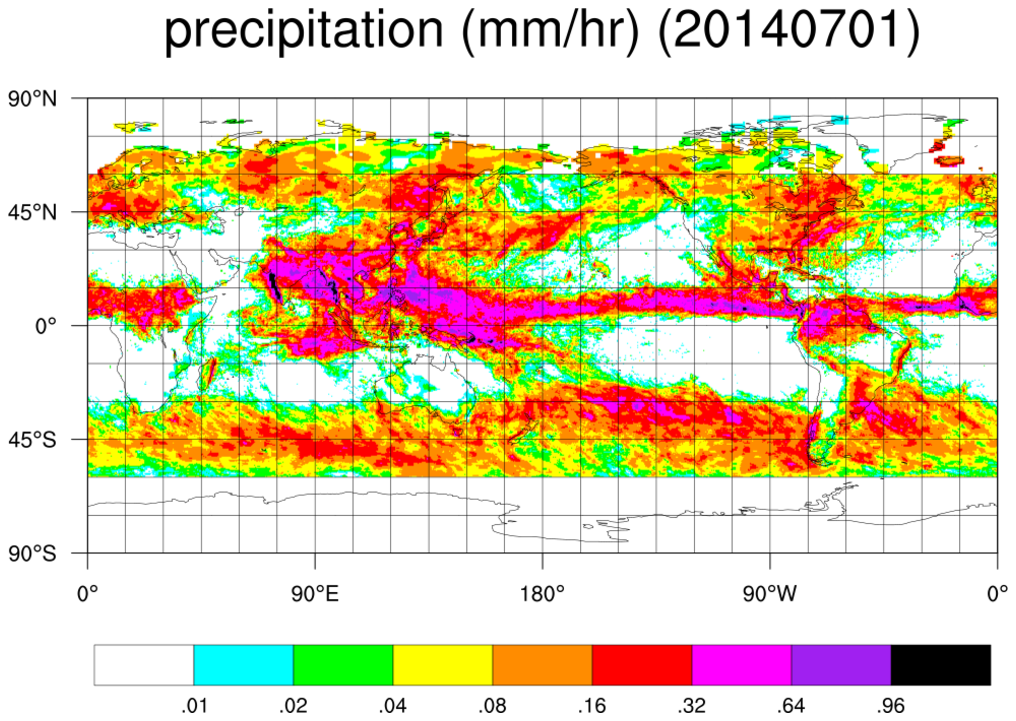
grb1.py
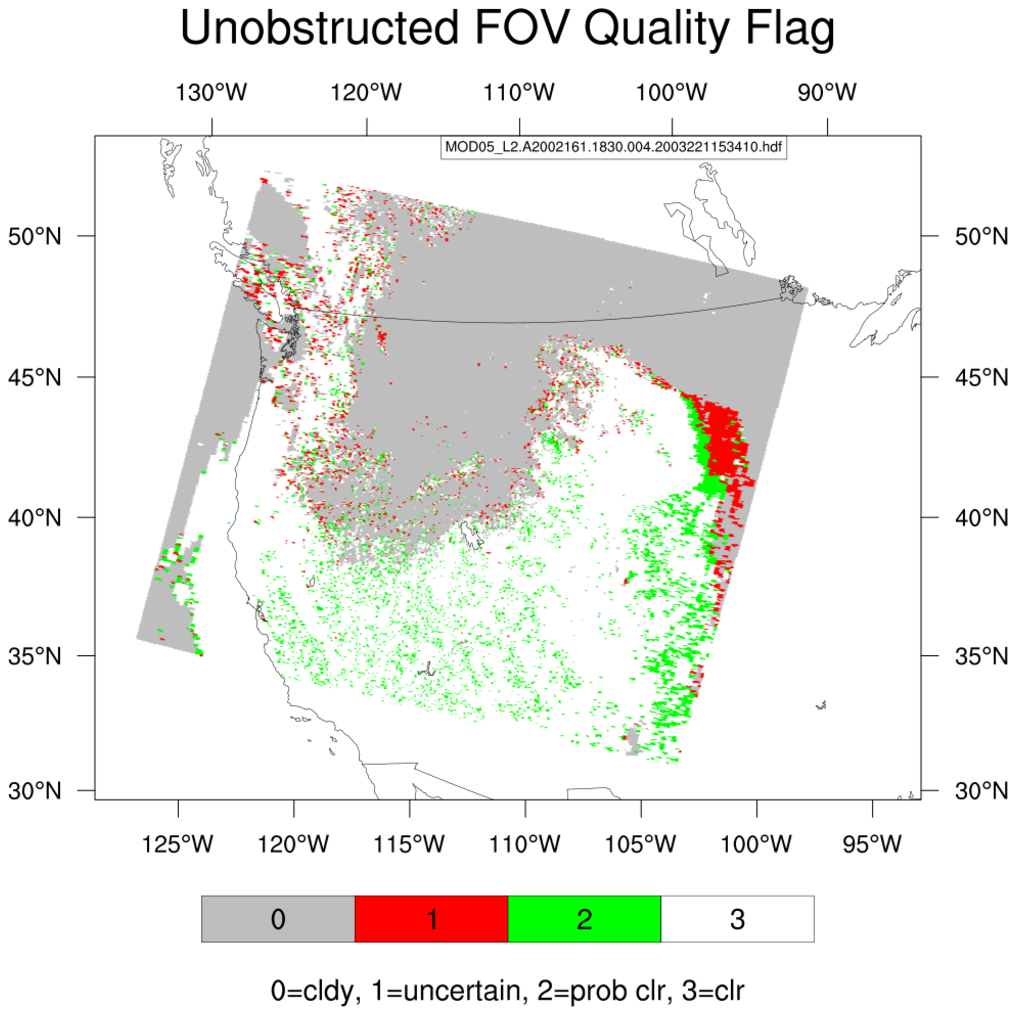
hdf1.py
hdf2.py
hdf3.py

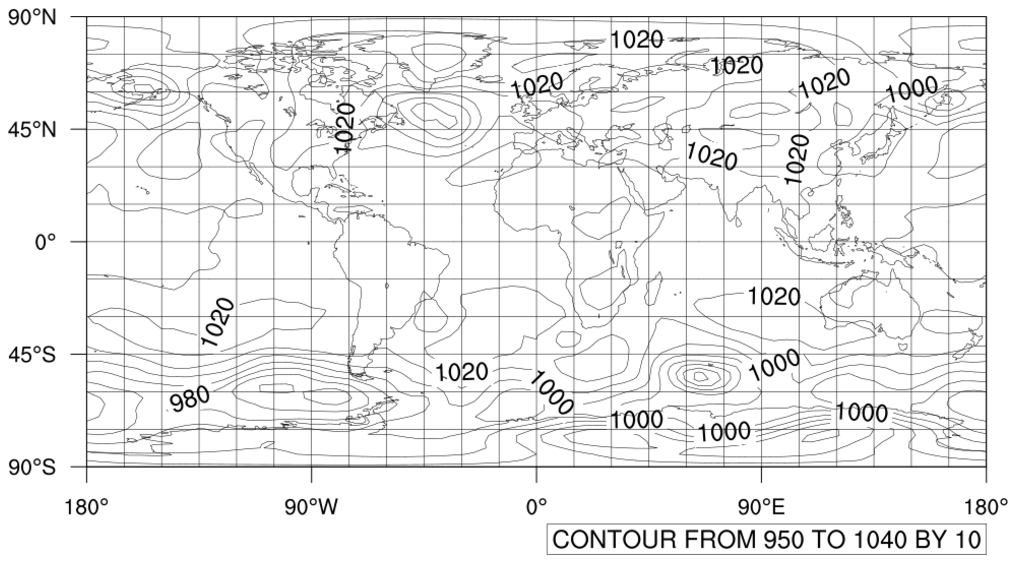
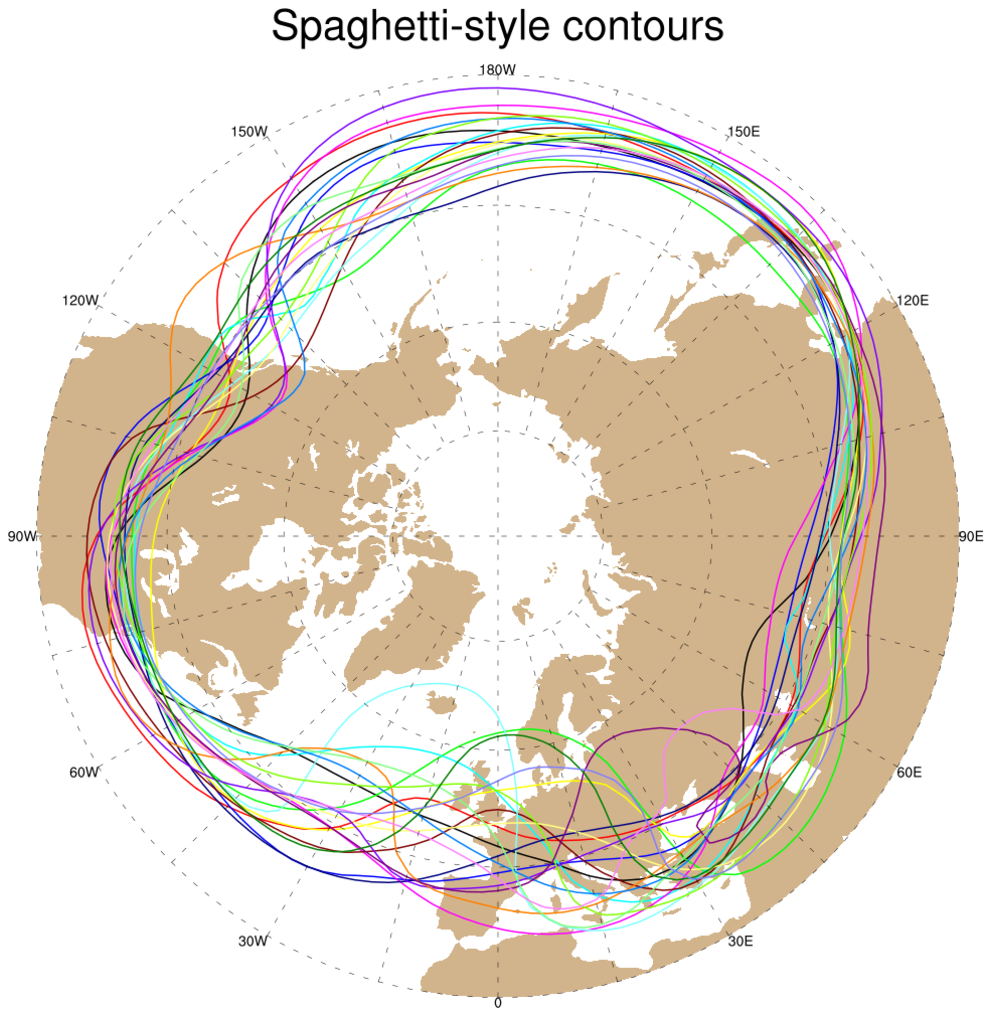
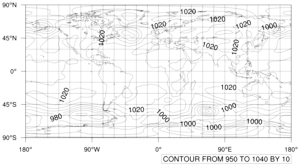
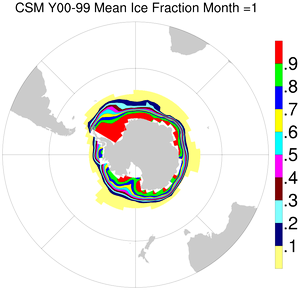
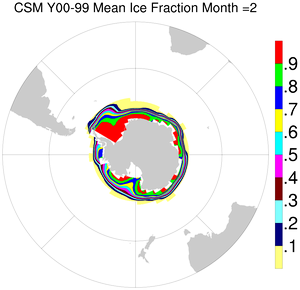
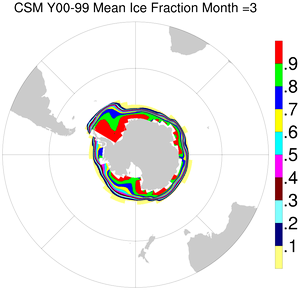
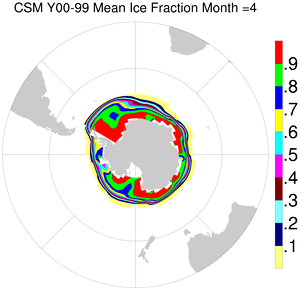
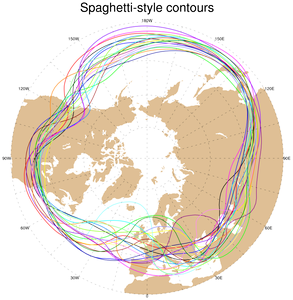
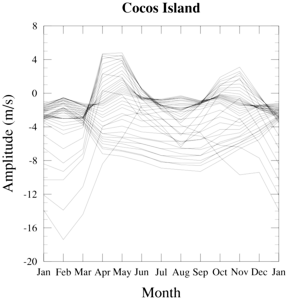
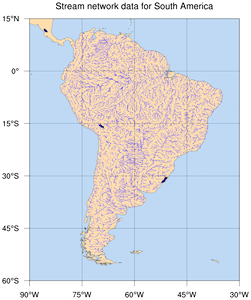
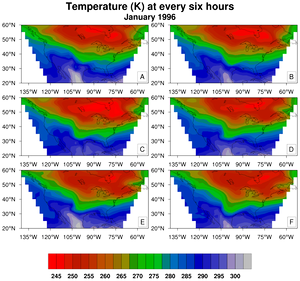
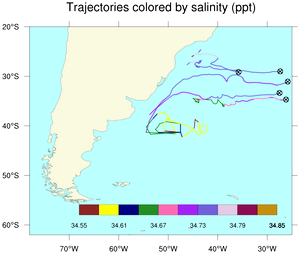
spaghetti.py
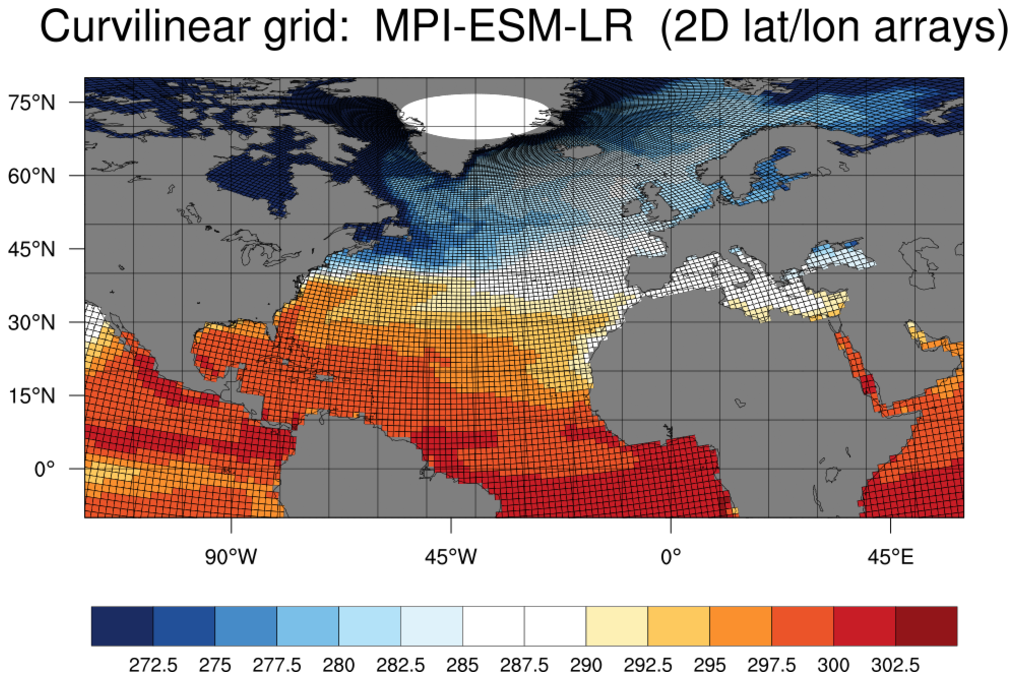
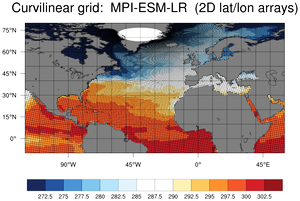
NUG_curvilinear_contour_PyNGL.py
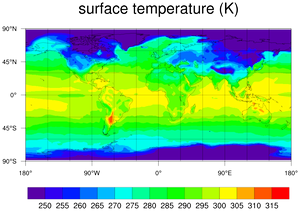
NUG_rectilinear_contour_PyNGL.py
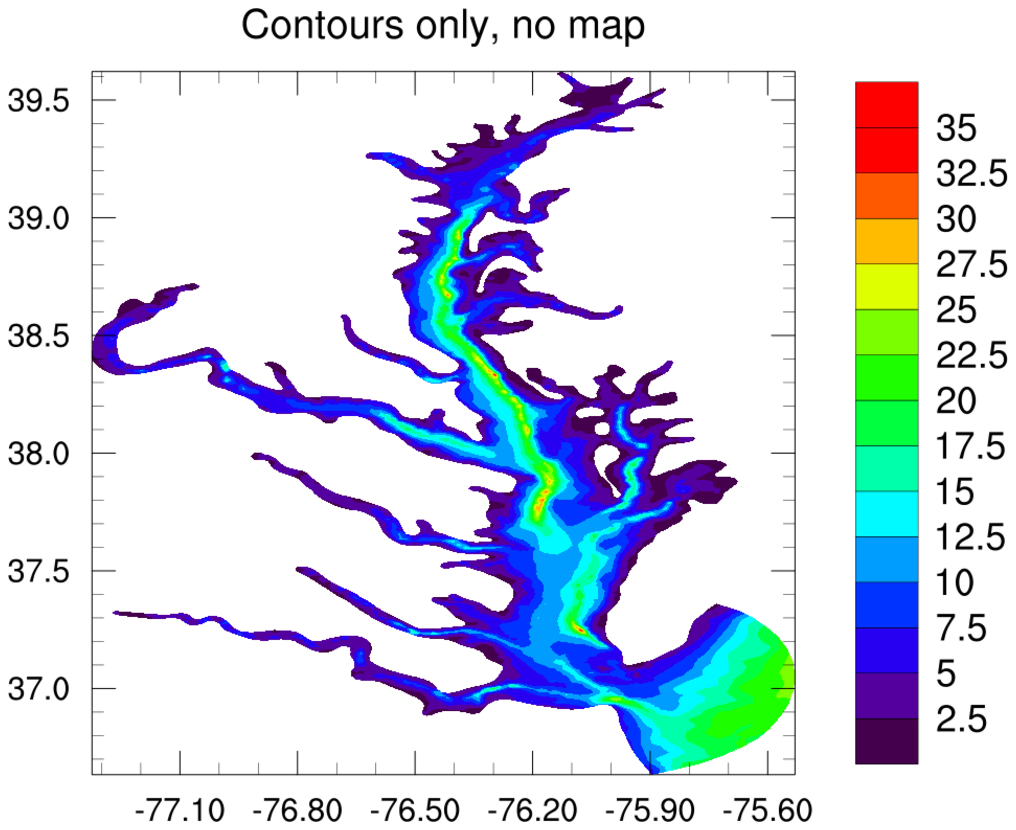
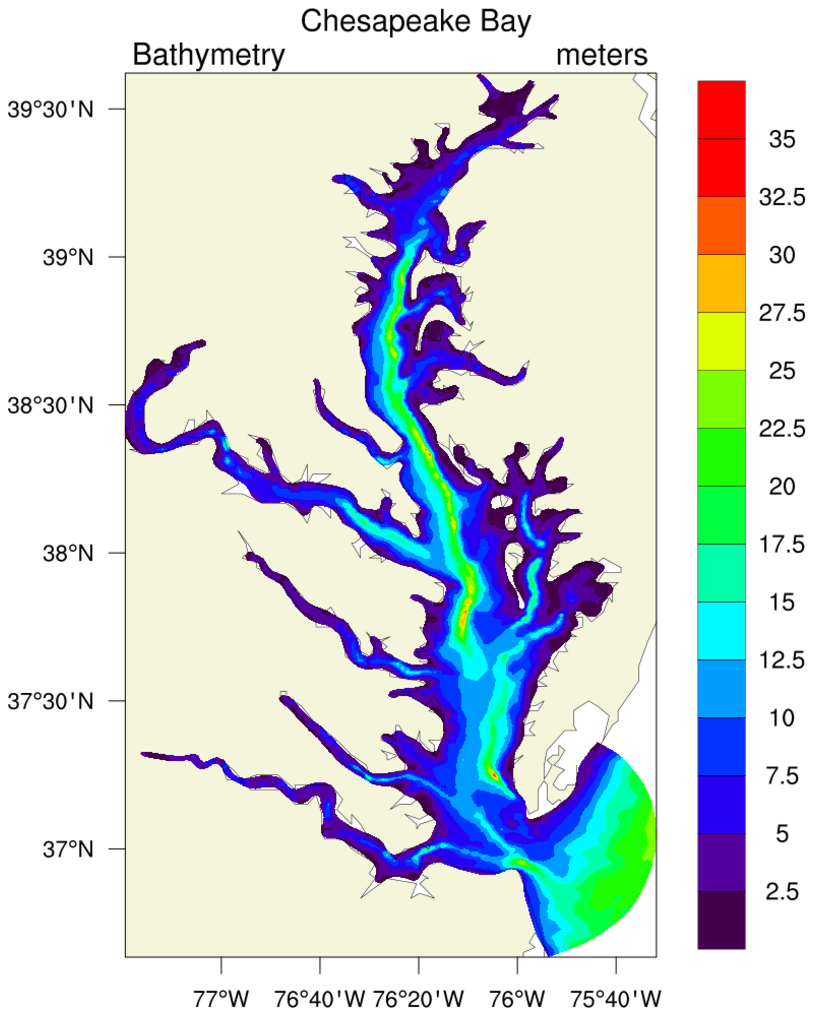
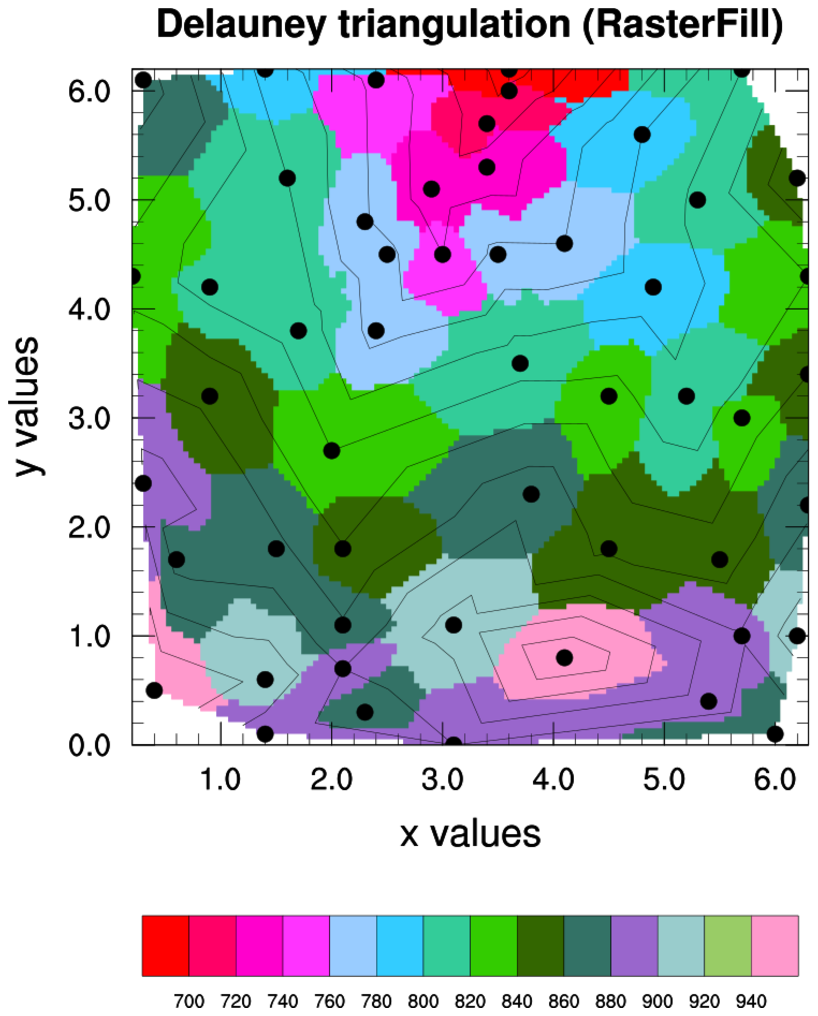
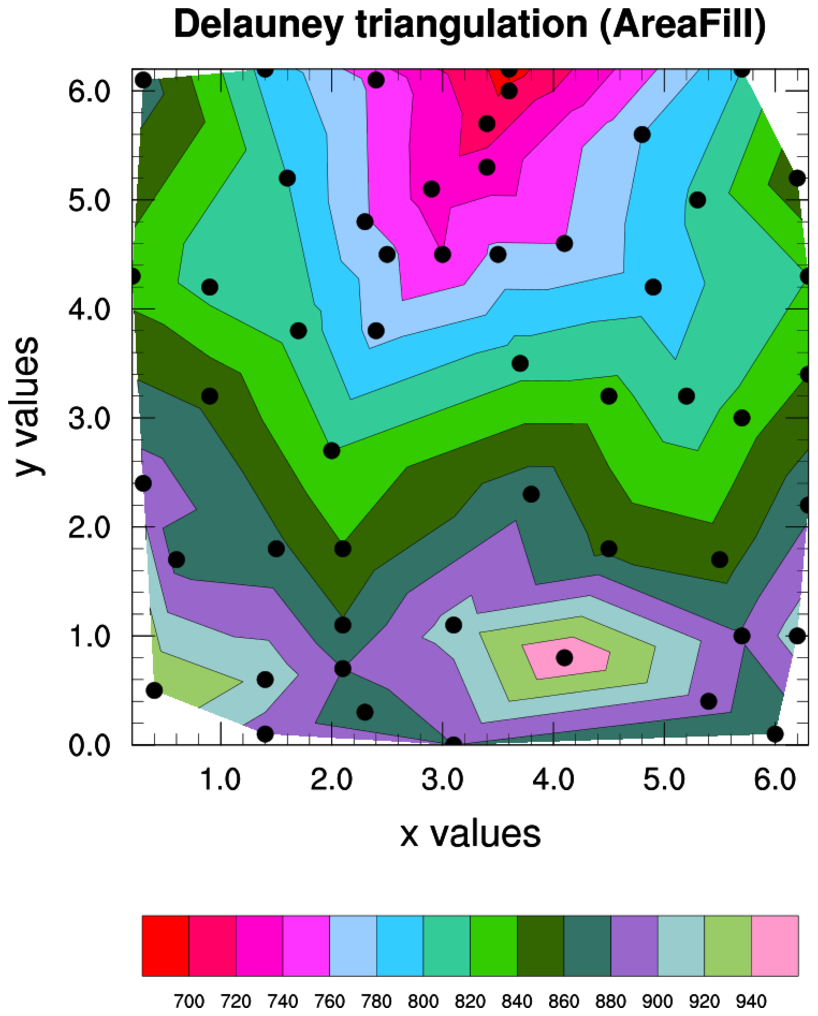
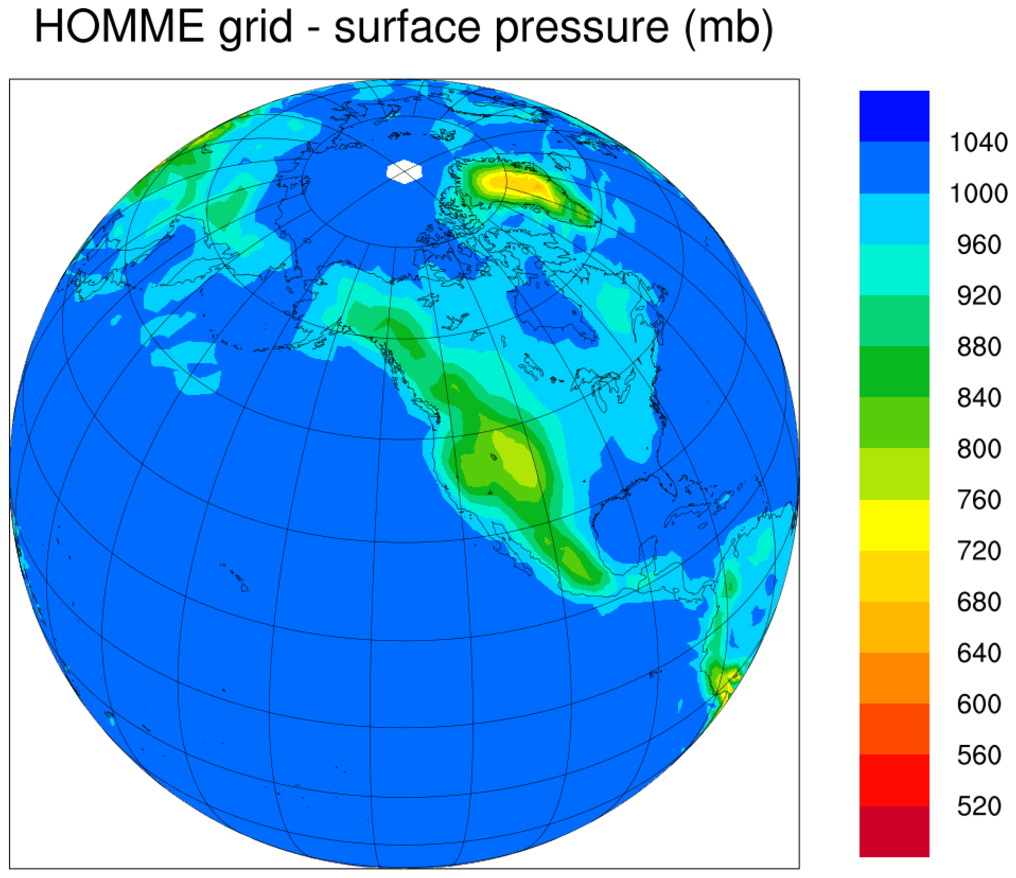
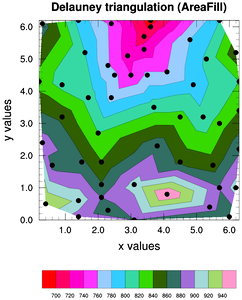
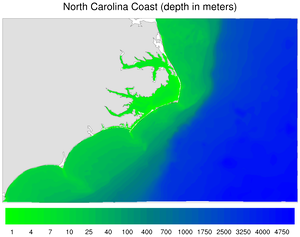
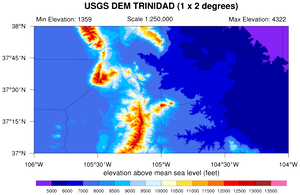
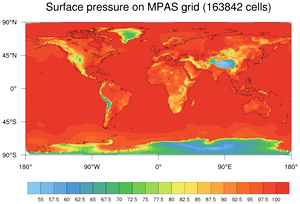
Contours of unstructured data
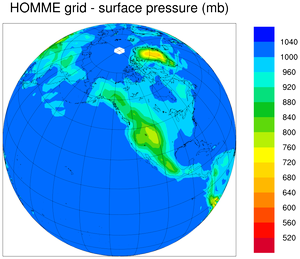
camse1.py
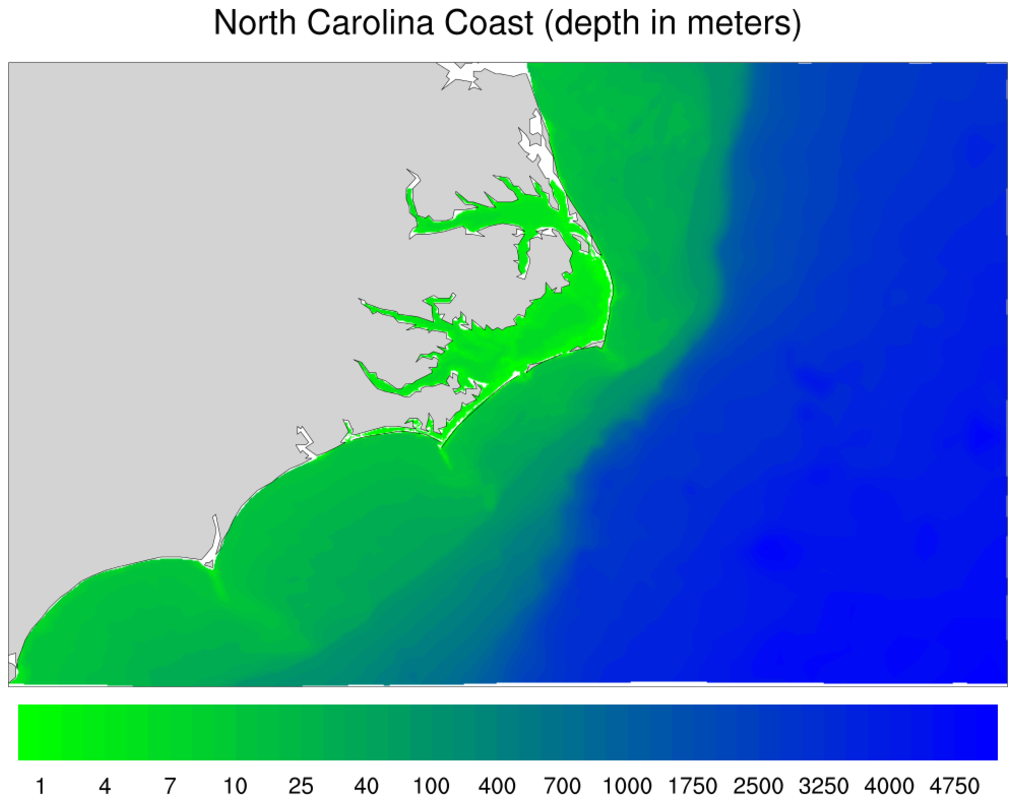
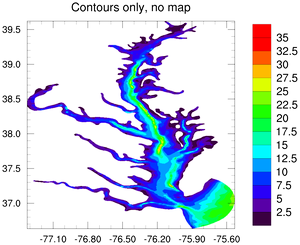
chkbay.py

contour_xyz.py
ctnccl.py
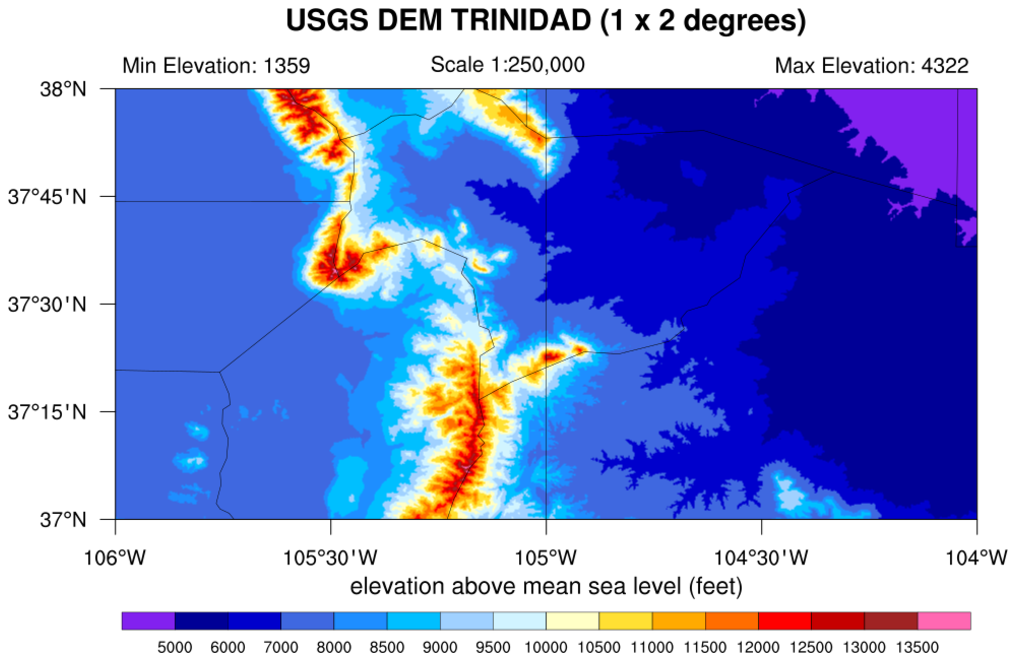
topo1.py
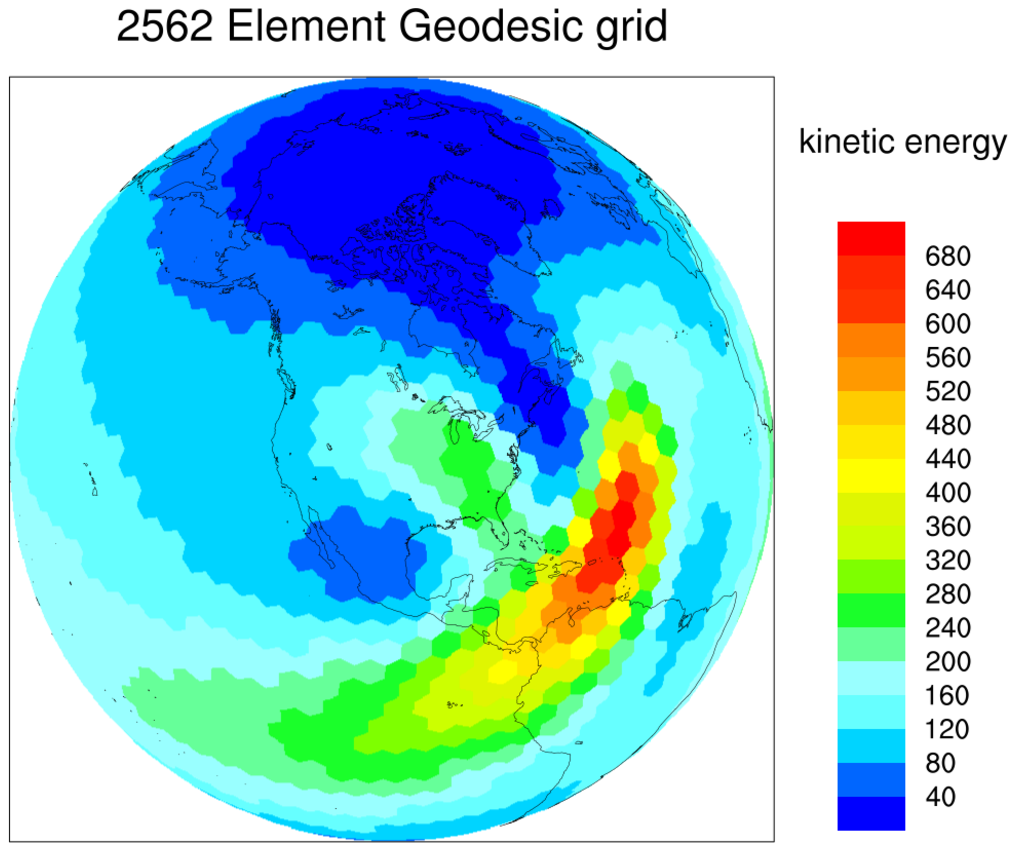
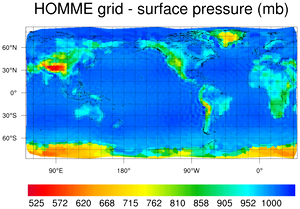
geodesic.py


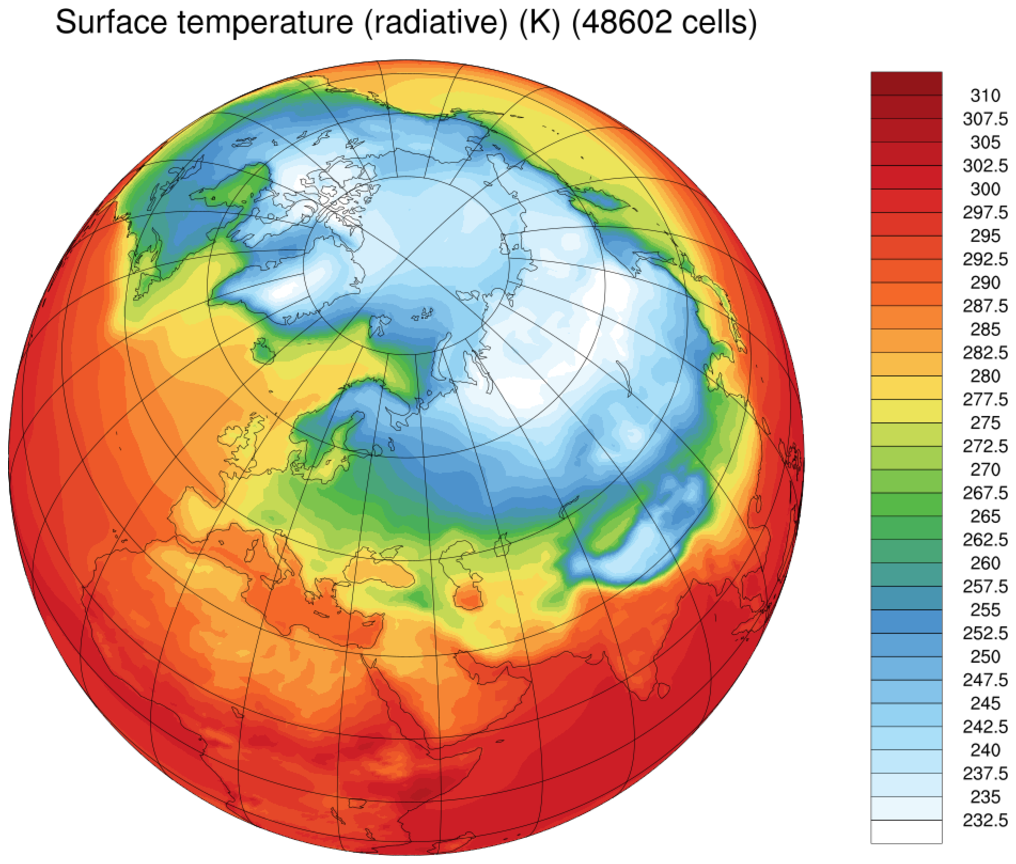
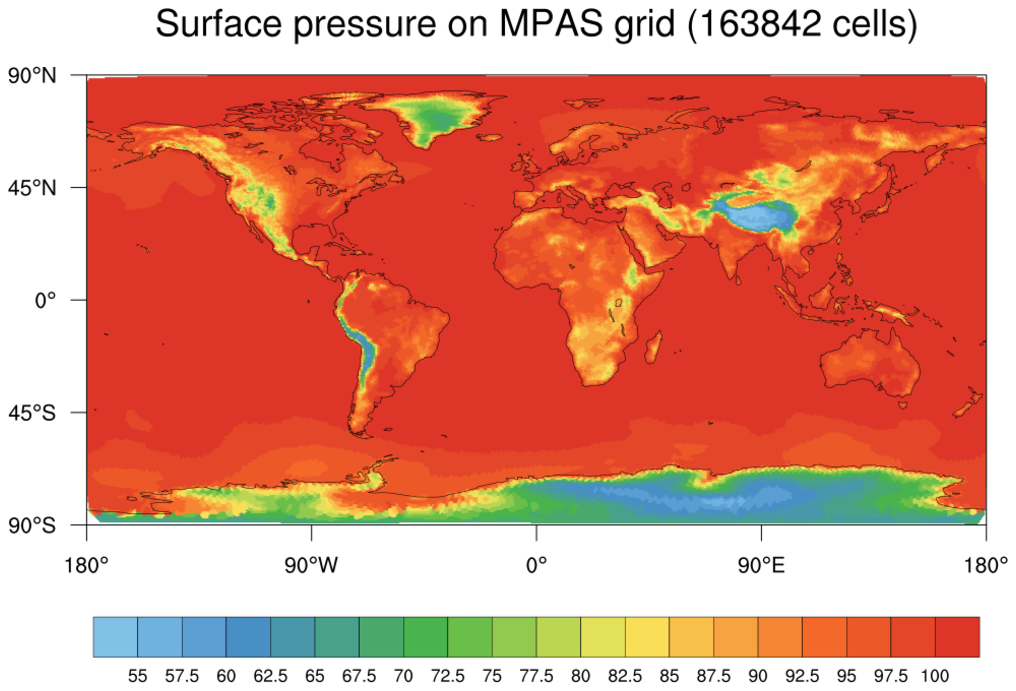
mpas1.py
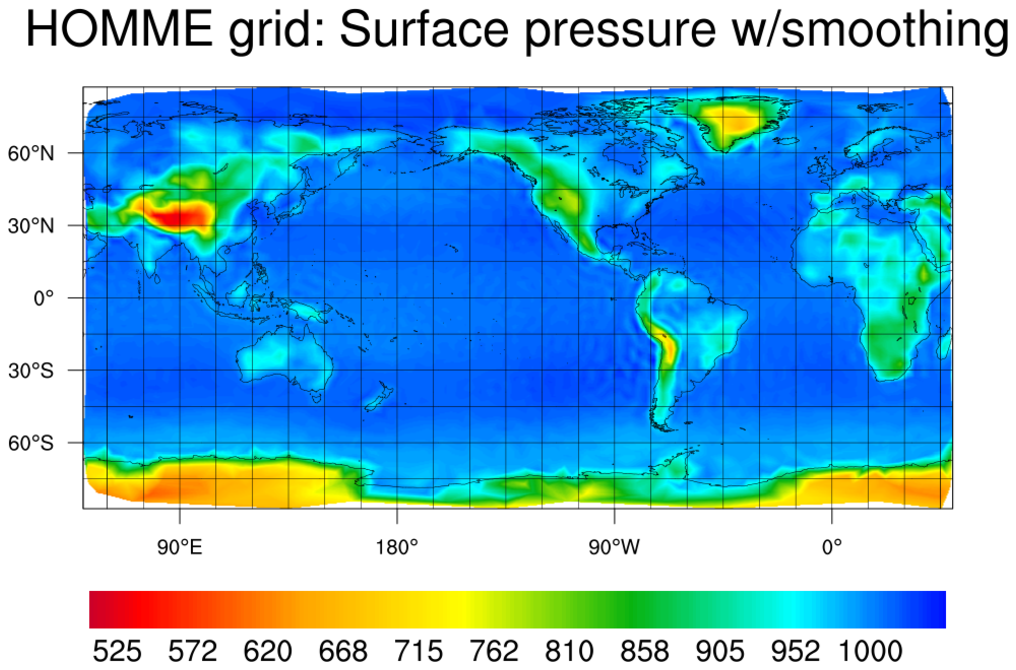
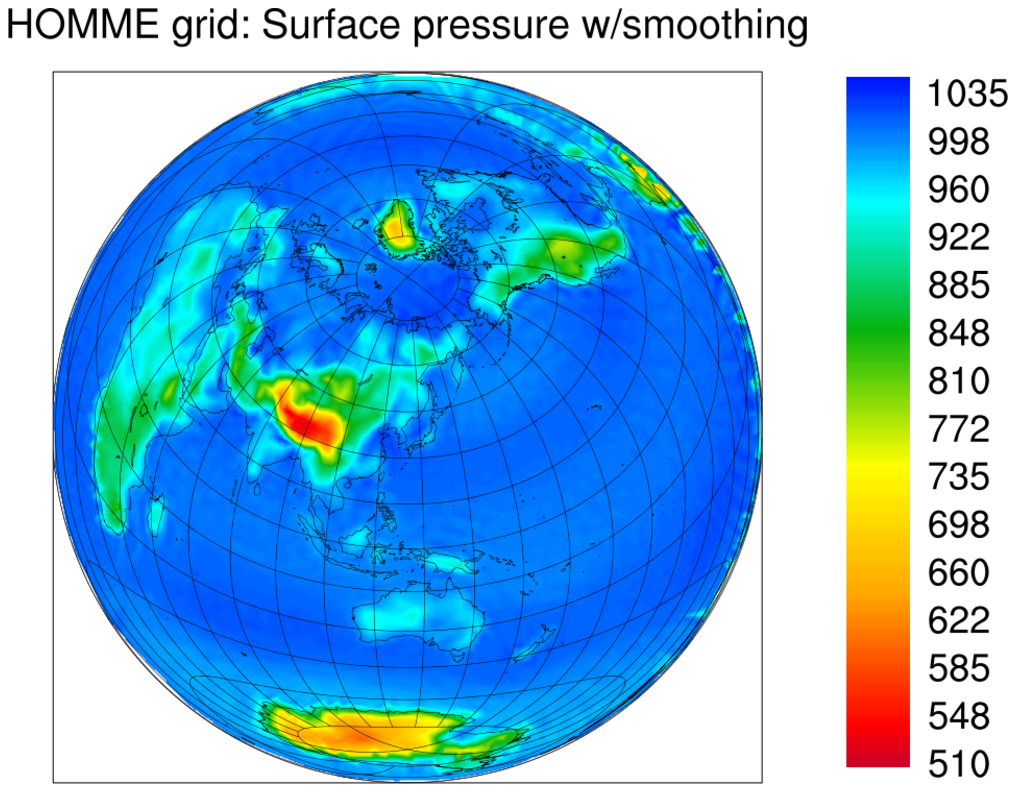
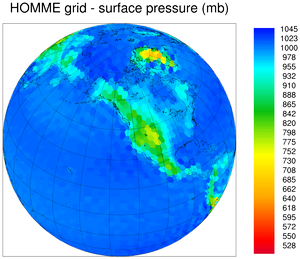
seam.py


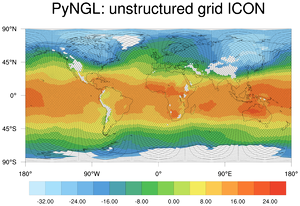
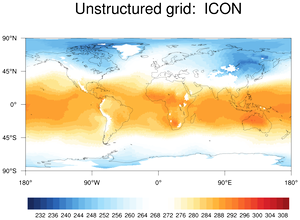
NUG_unstructured_ICON_triangles_PyNGL.py
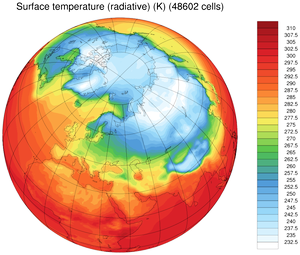
NUG_unstructured_contour_cellfill_PyNGL.py
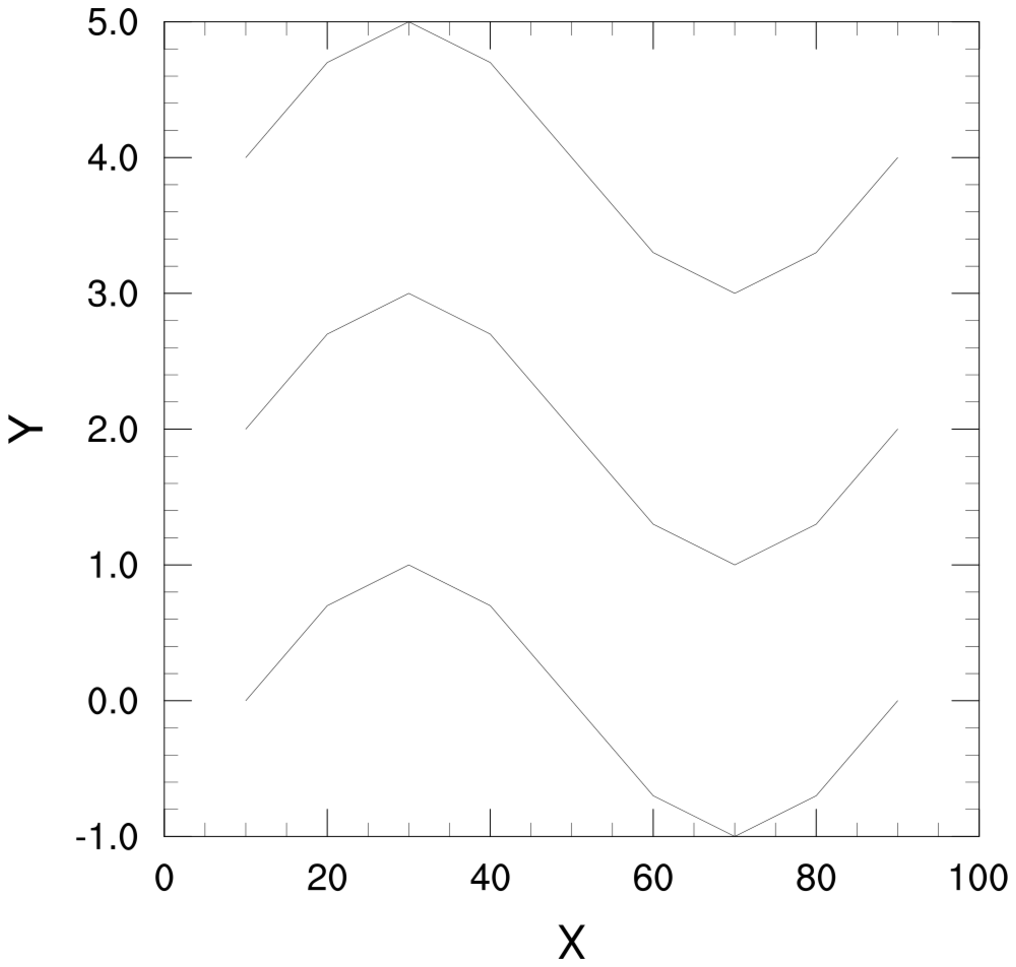
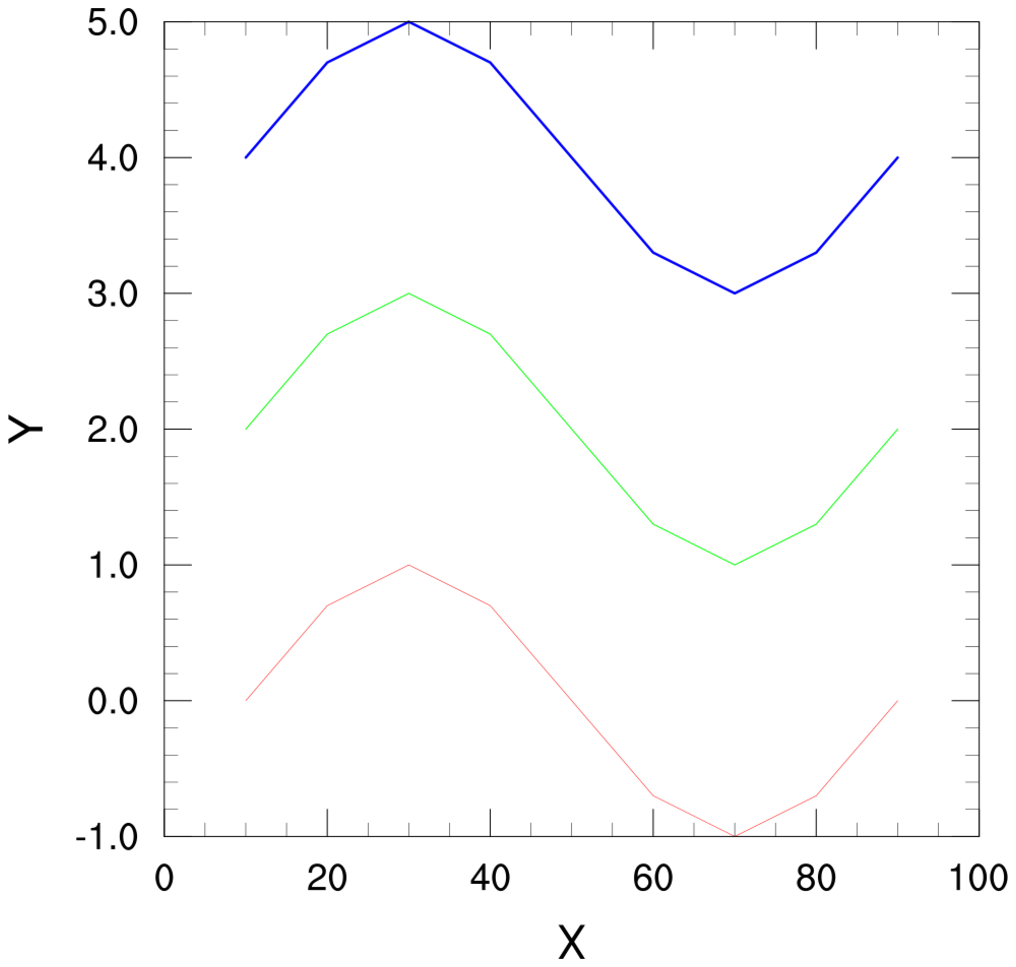
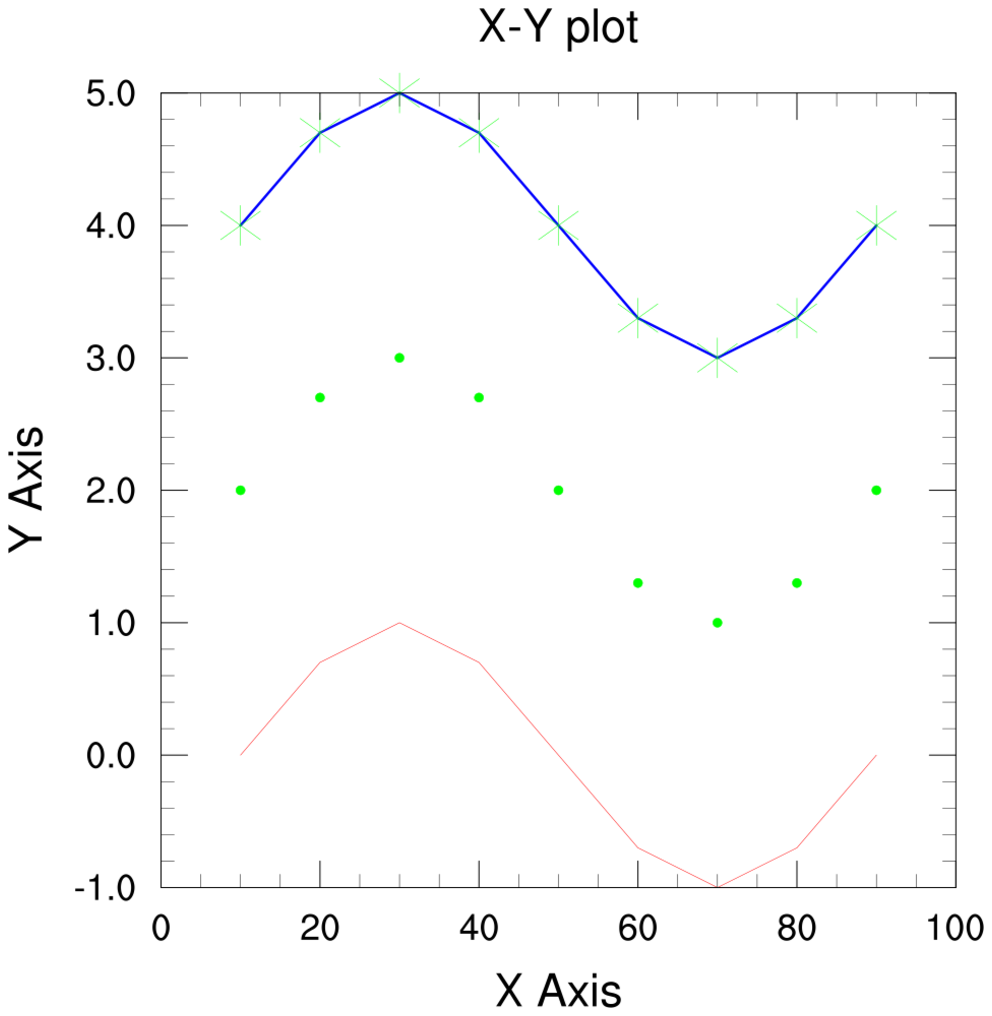
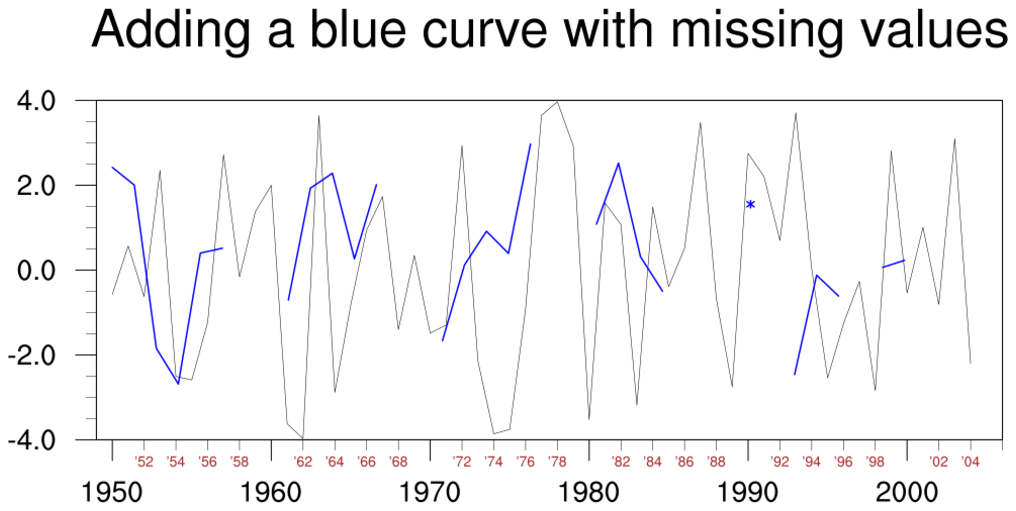
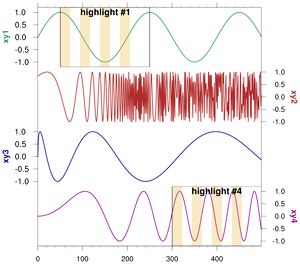
XY plots
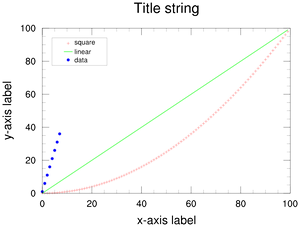
xy1.py
xy2.py
xy3.py
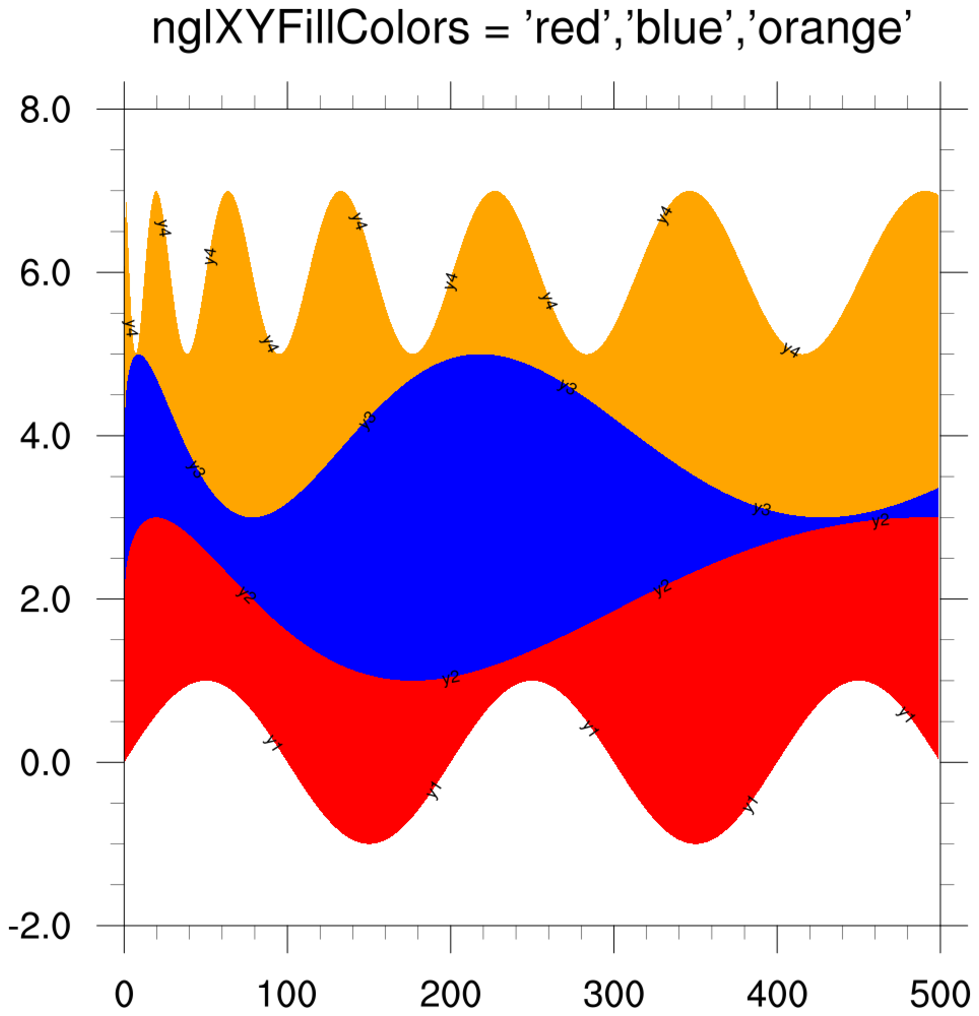
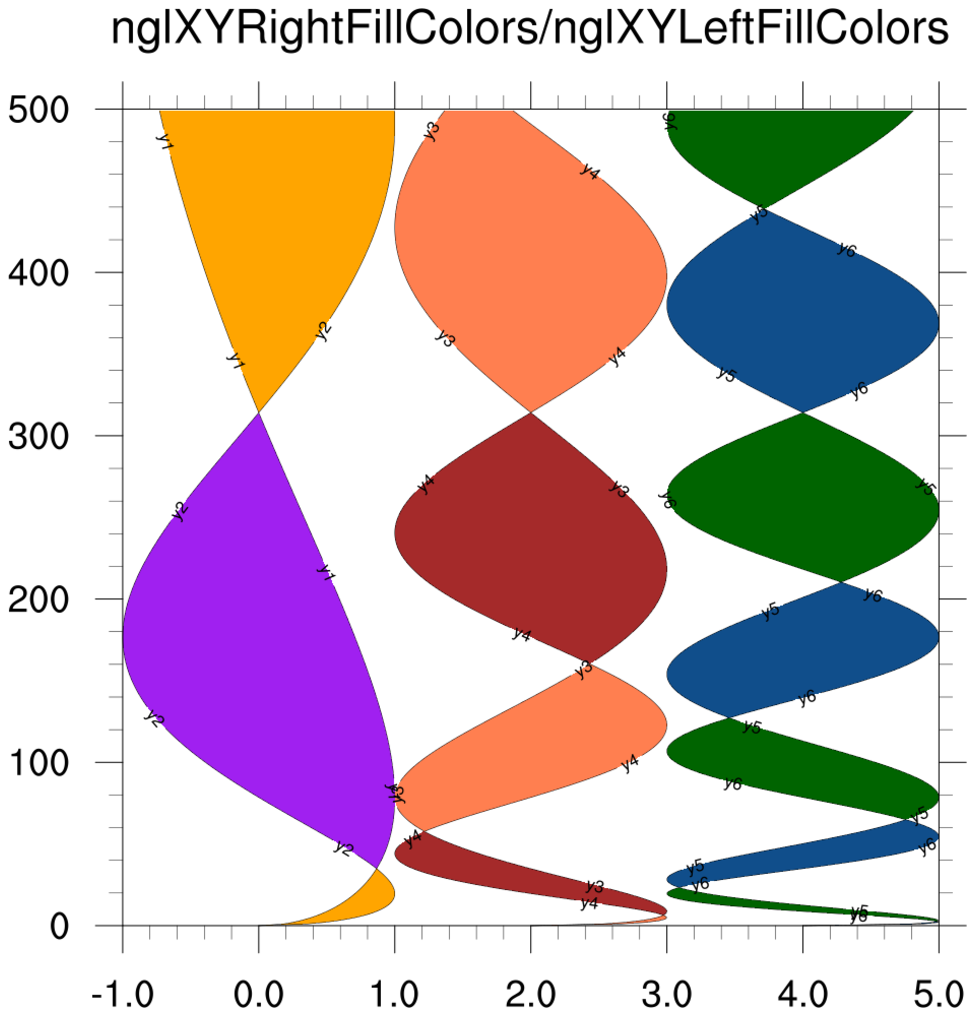
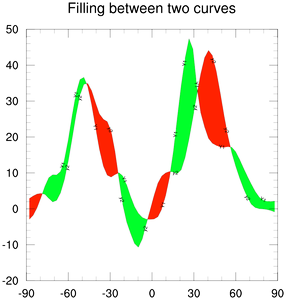
fillxy1.py
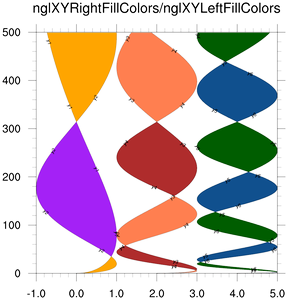
fillxy2.py

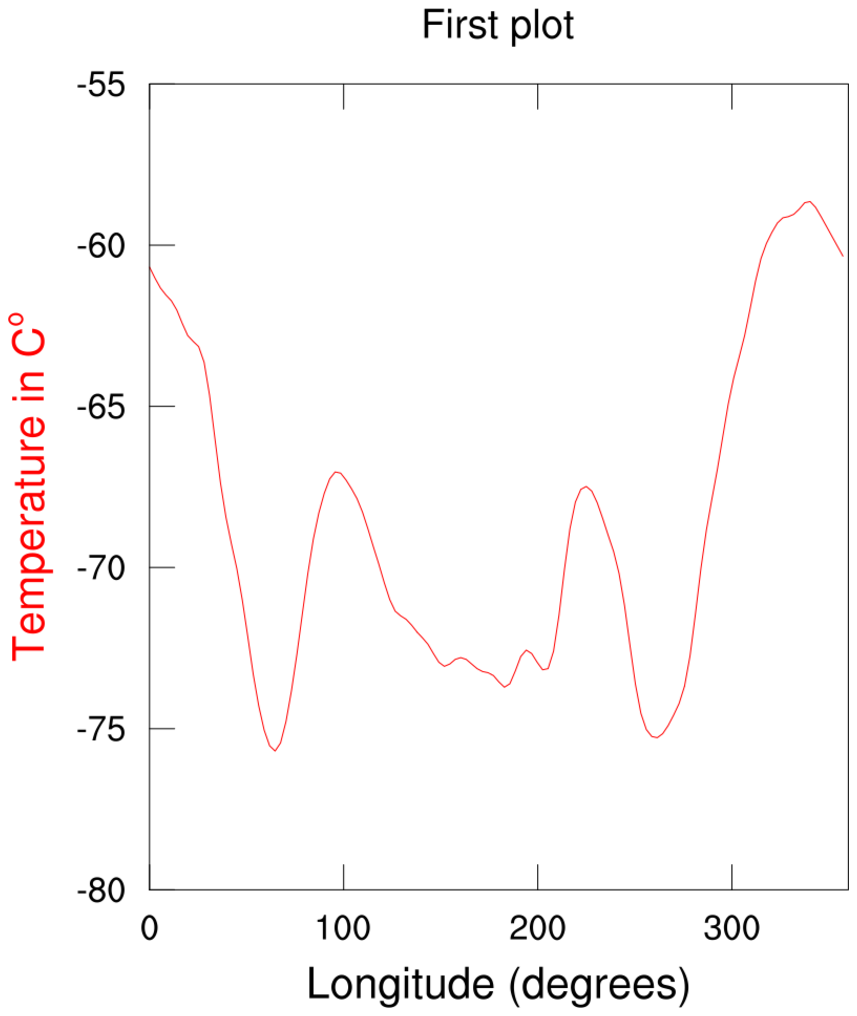
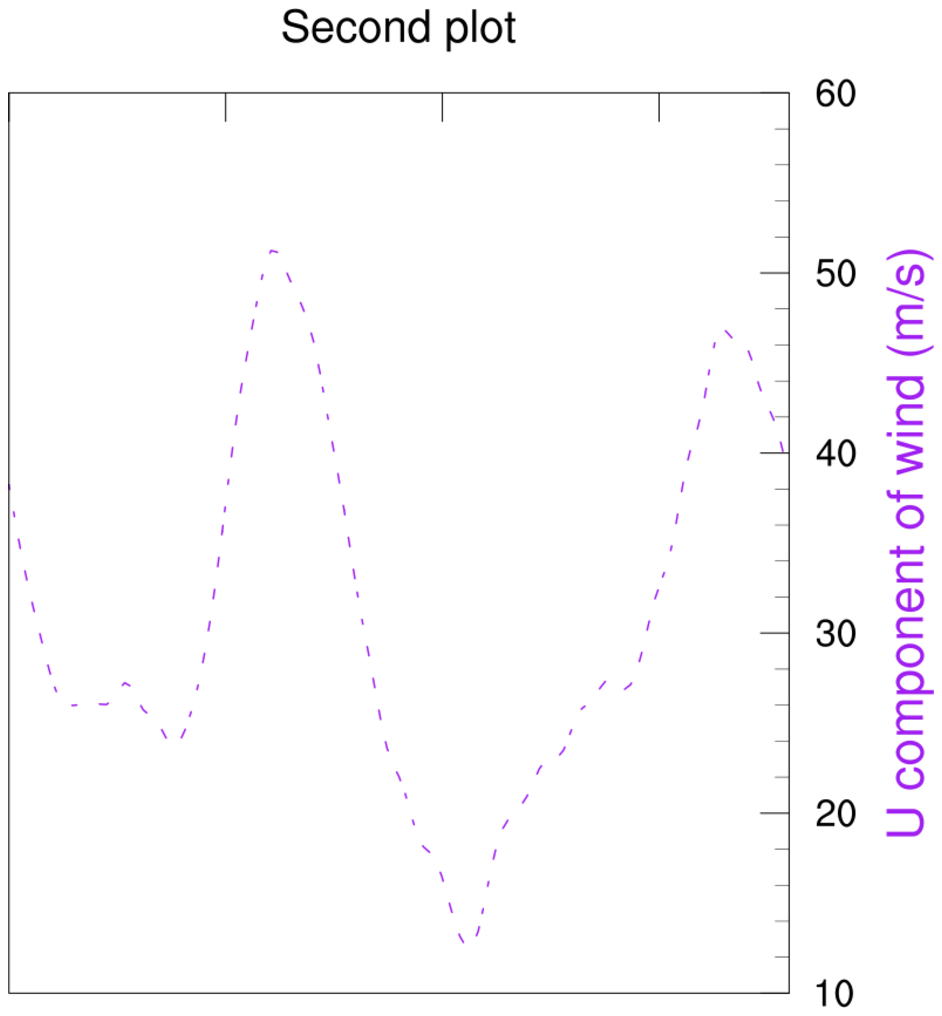
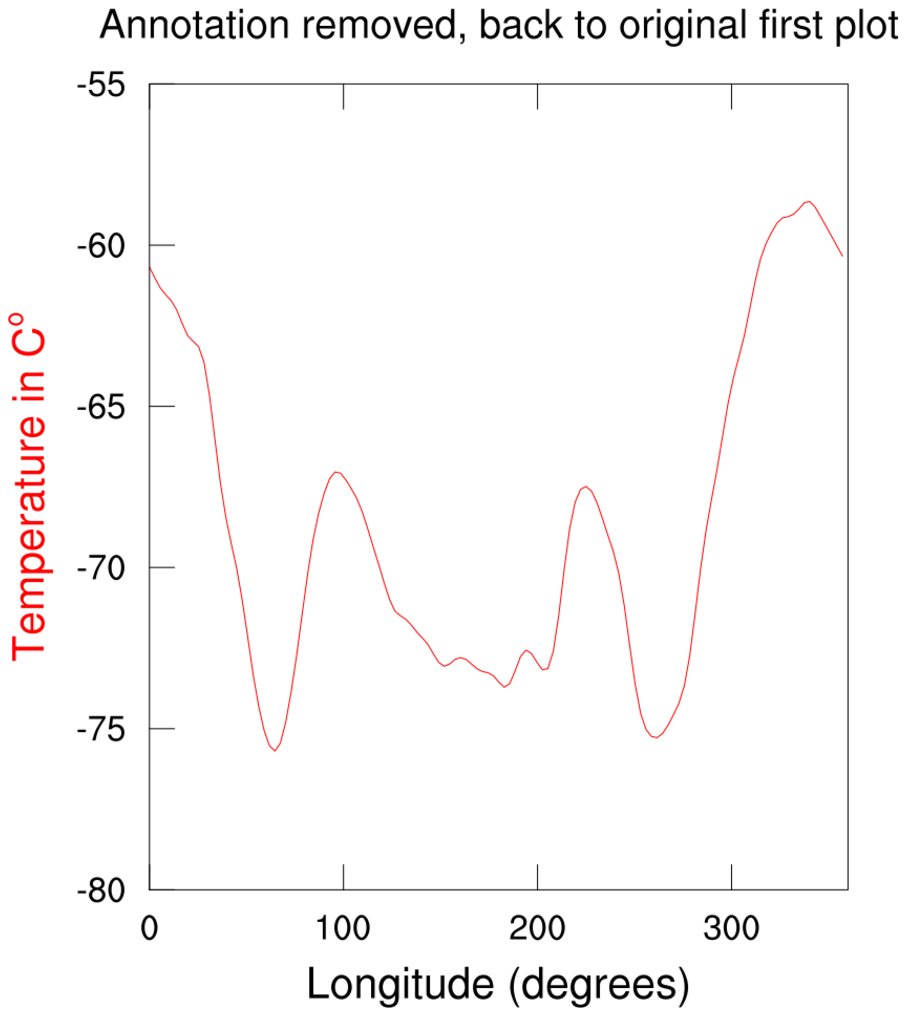
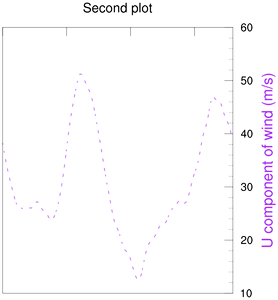
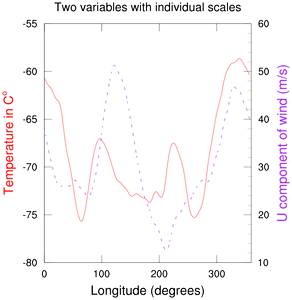
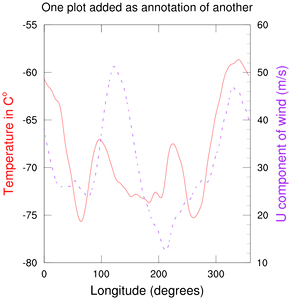
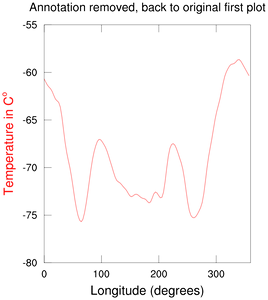
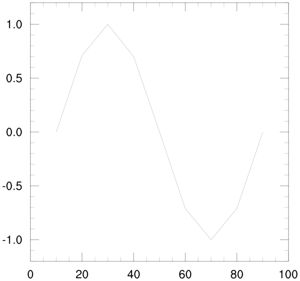
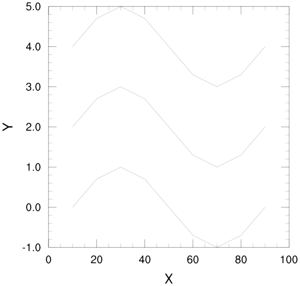
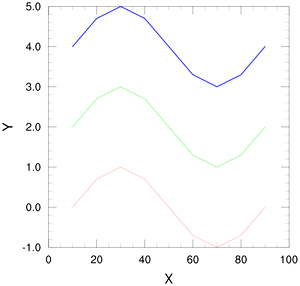
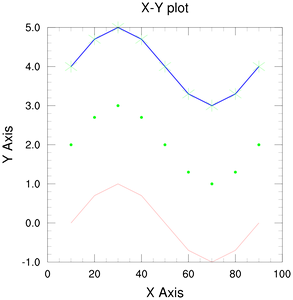
multi_y.py

ngl01p.py

ngl08p.py
ngl10p.py
ngl11p.py
datatondc1.py
NUG_xy_plot_simple_PyNGL.py
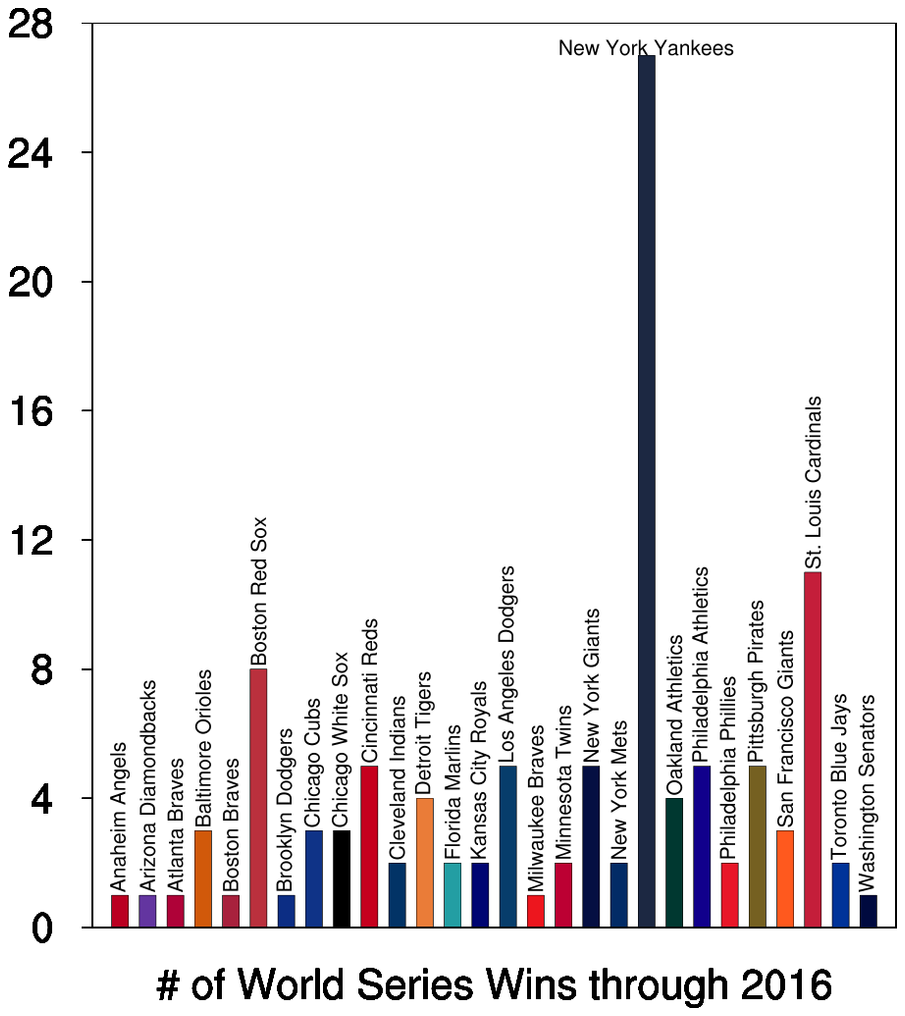
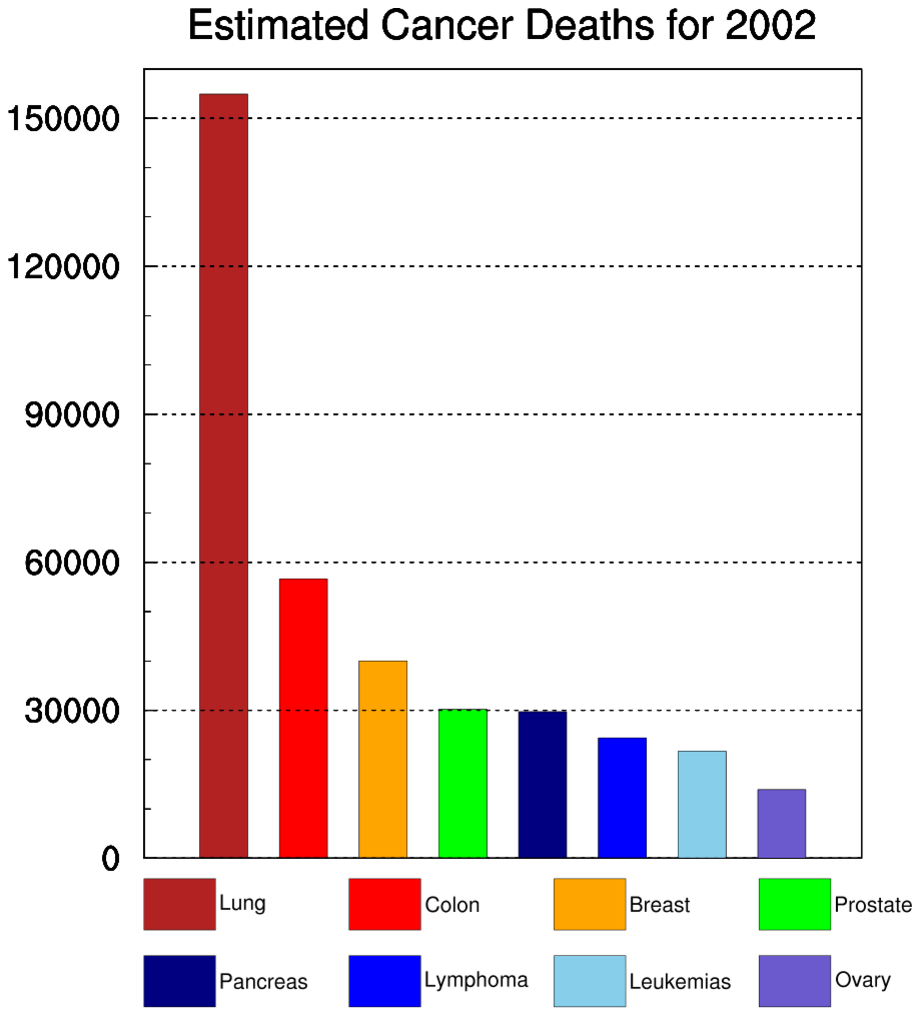
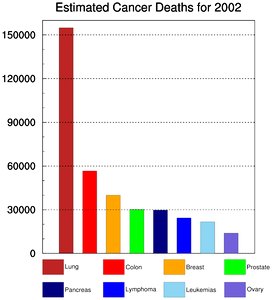
Bar plots
bar1.py
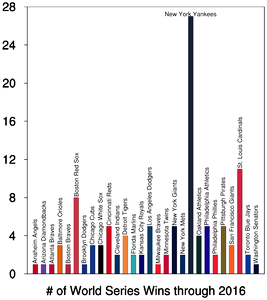
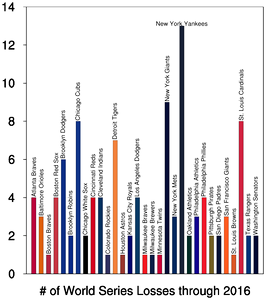
bar2.py
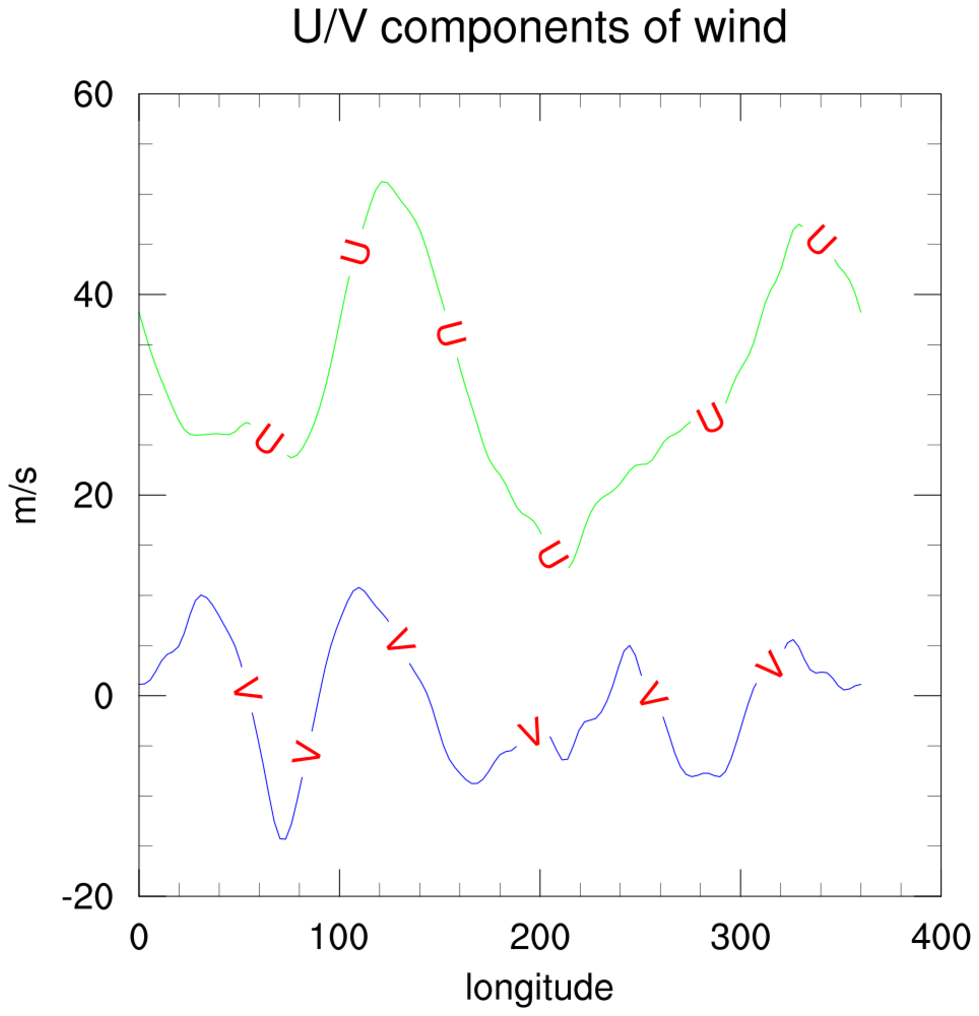
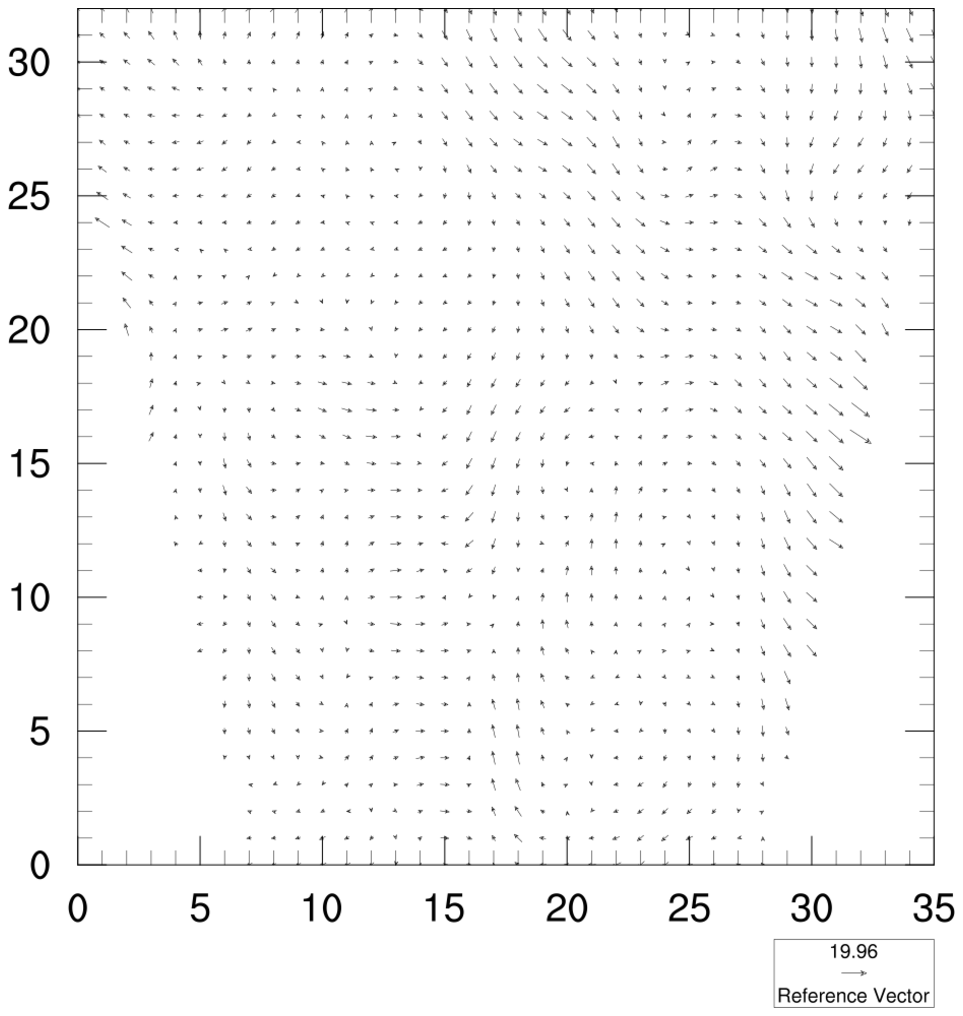
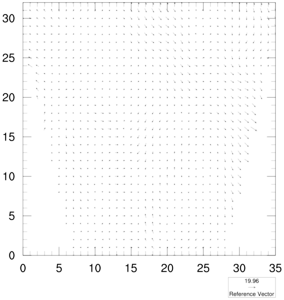
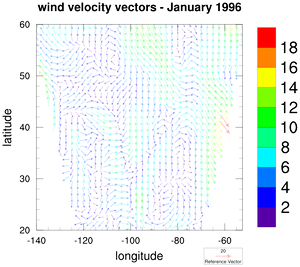
Basic vector plots
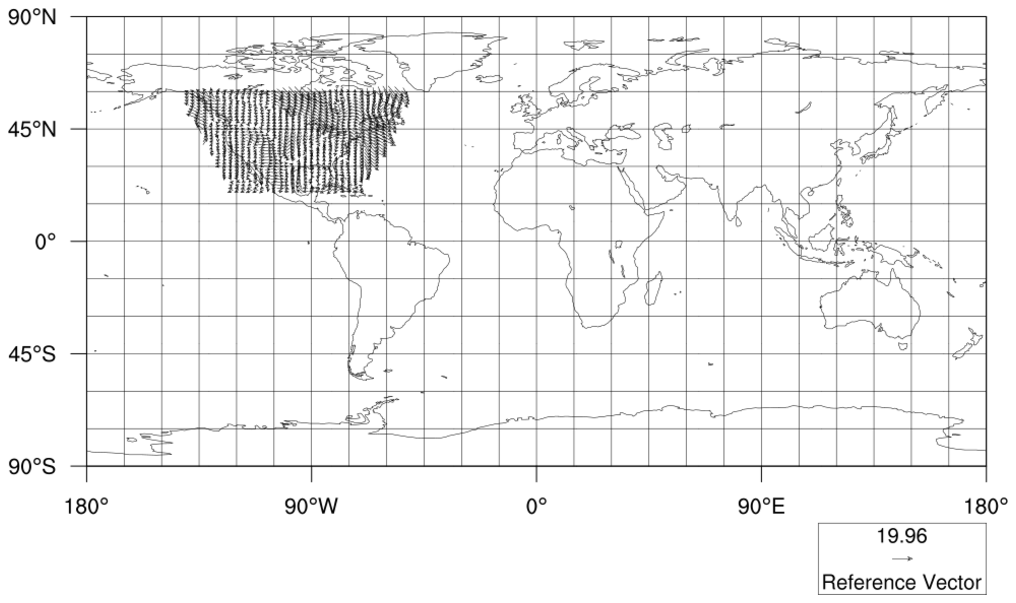
ngl03p.py

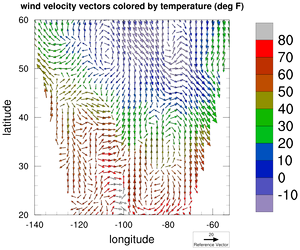
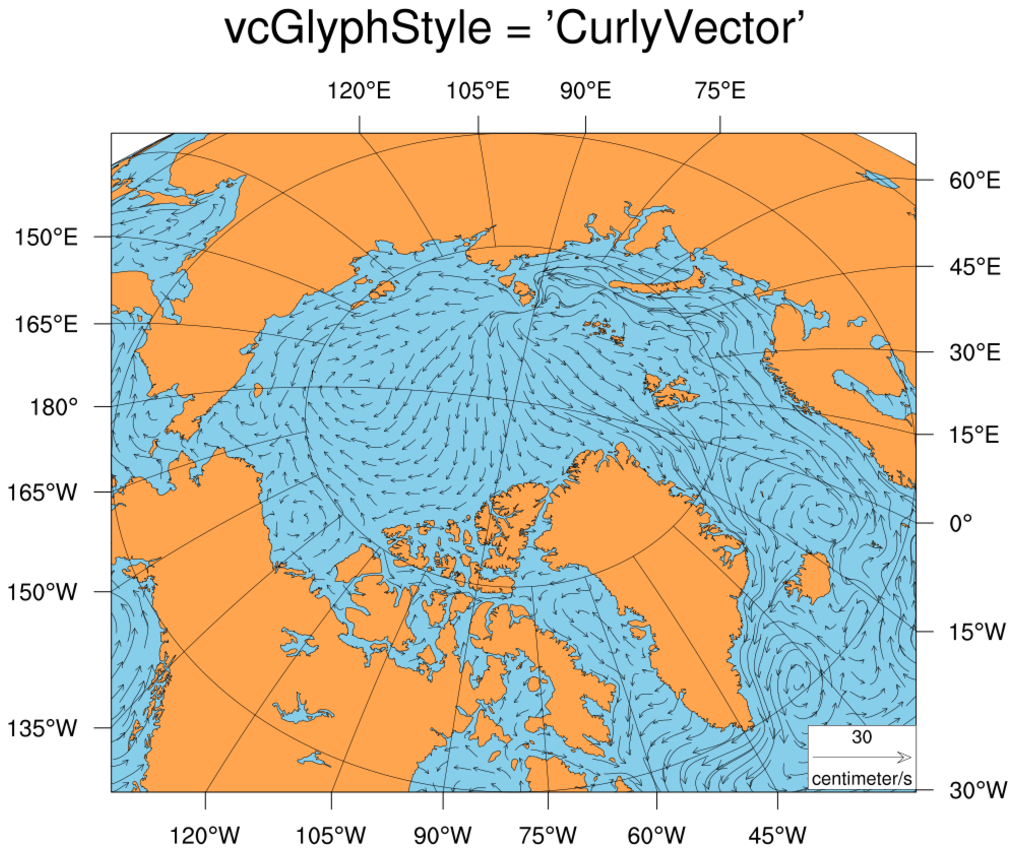
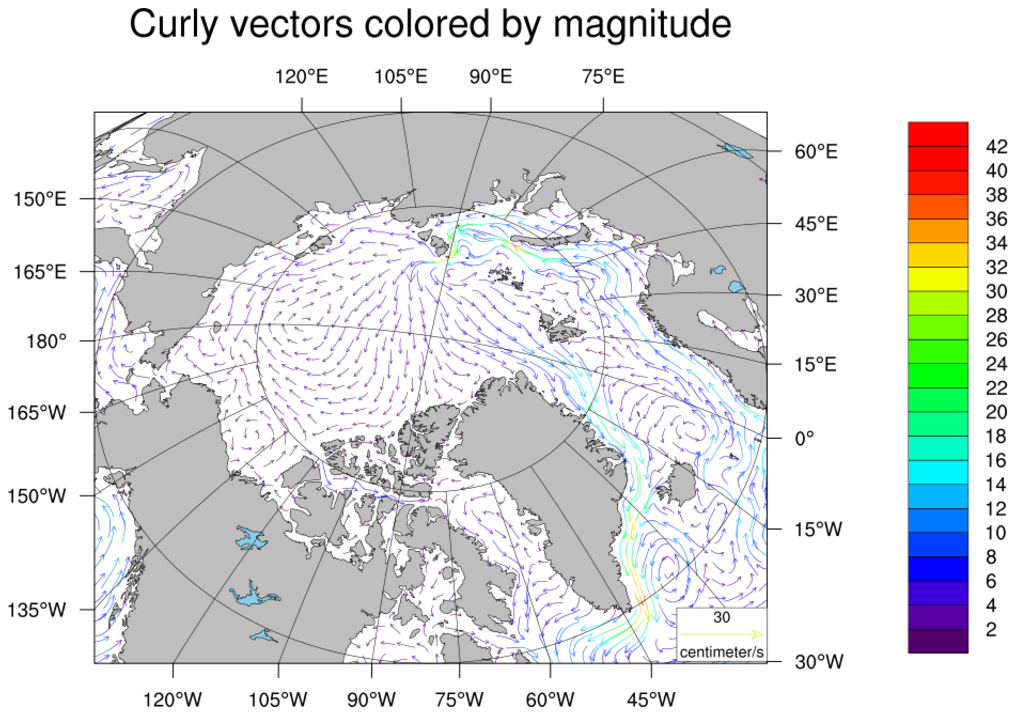
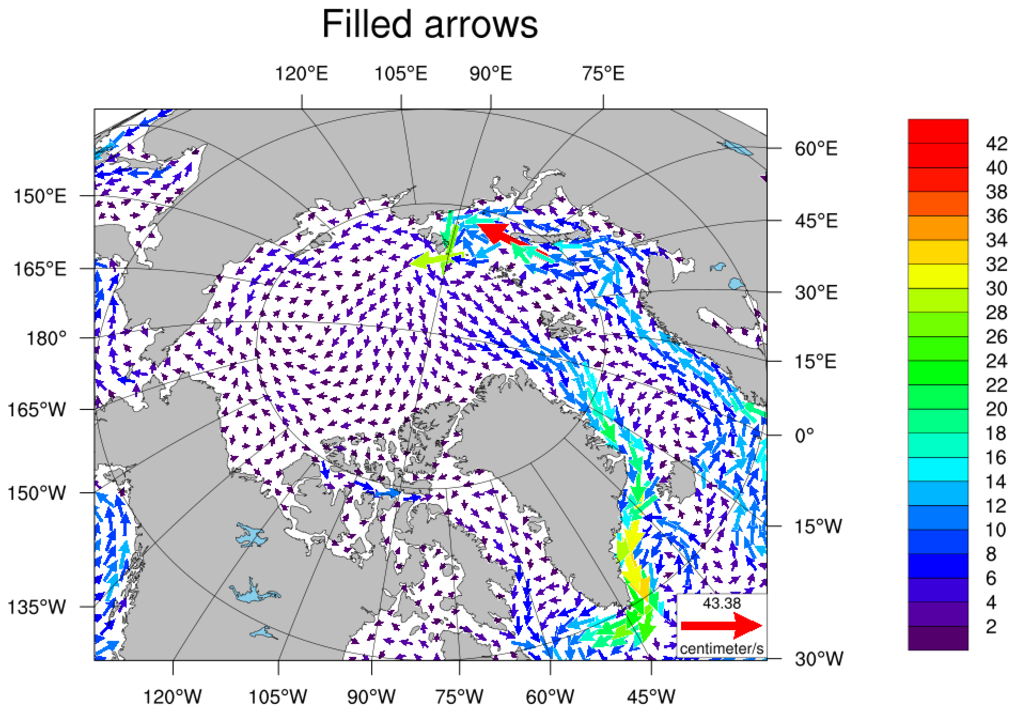
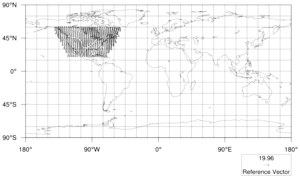
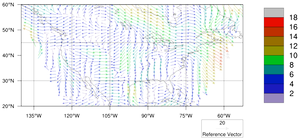
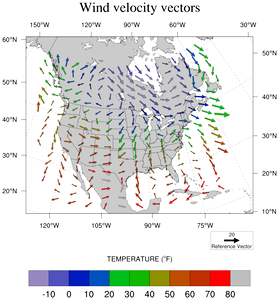
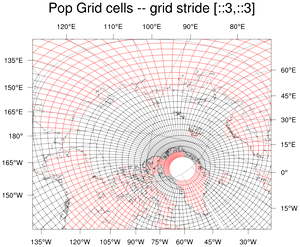
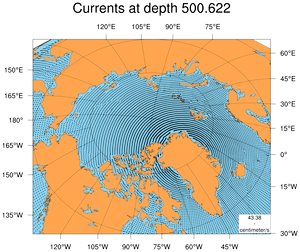
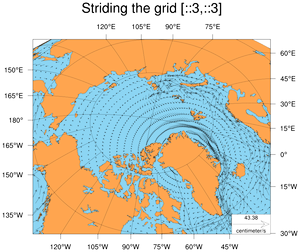
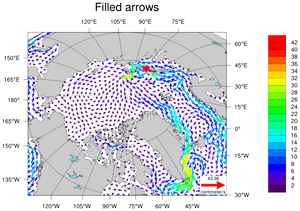
Vectors over maps
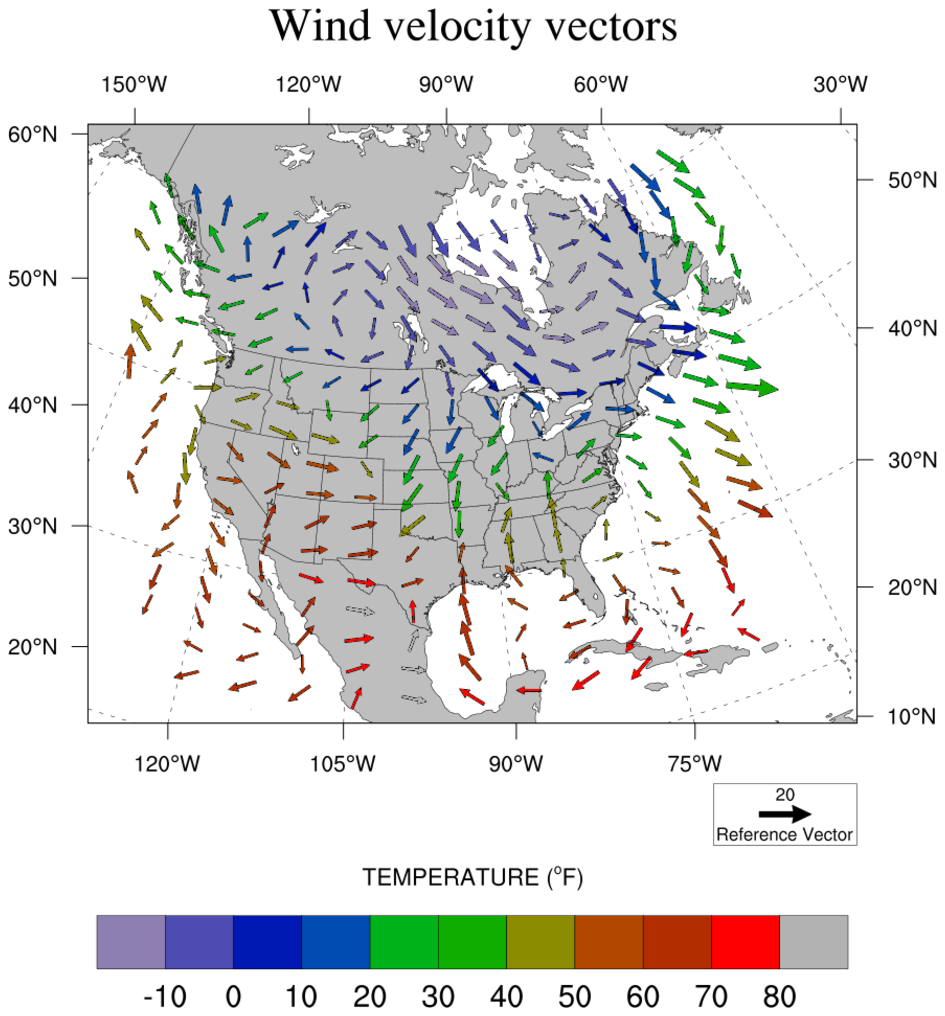
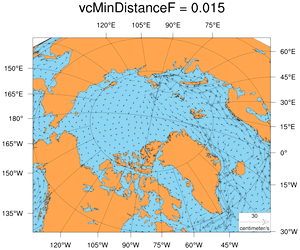
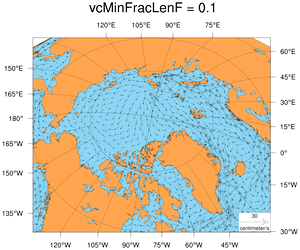
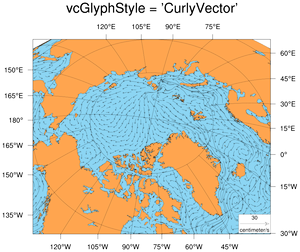
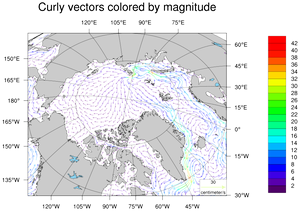
ngl06p.py
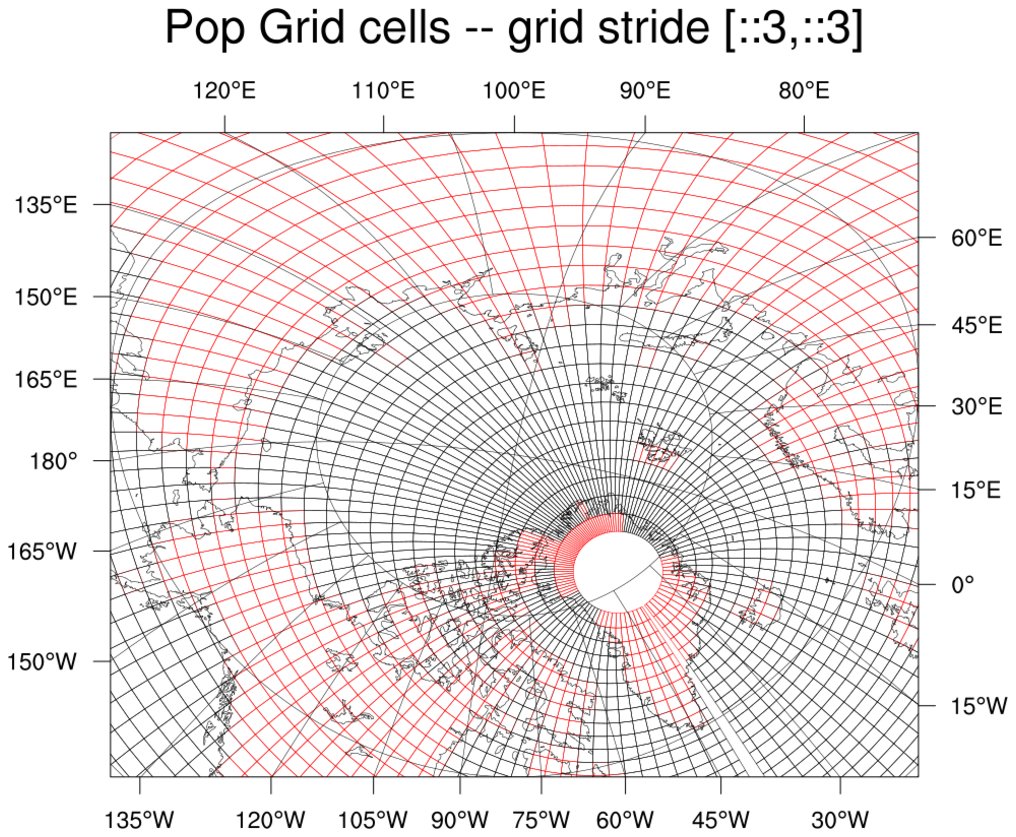
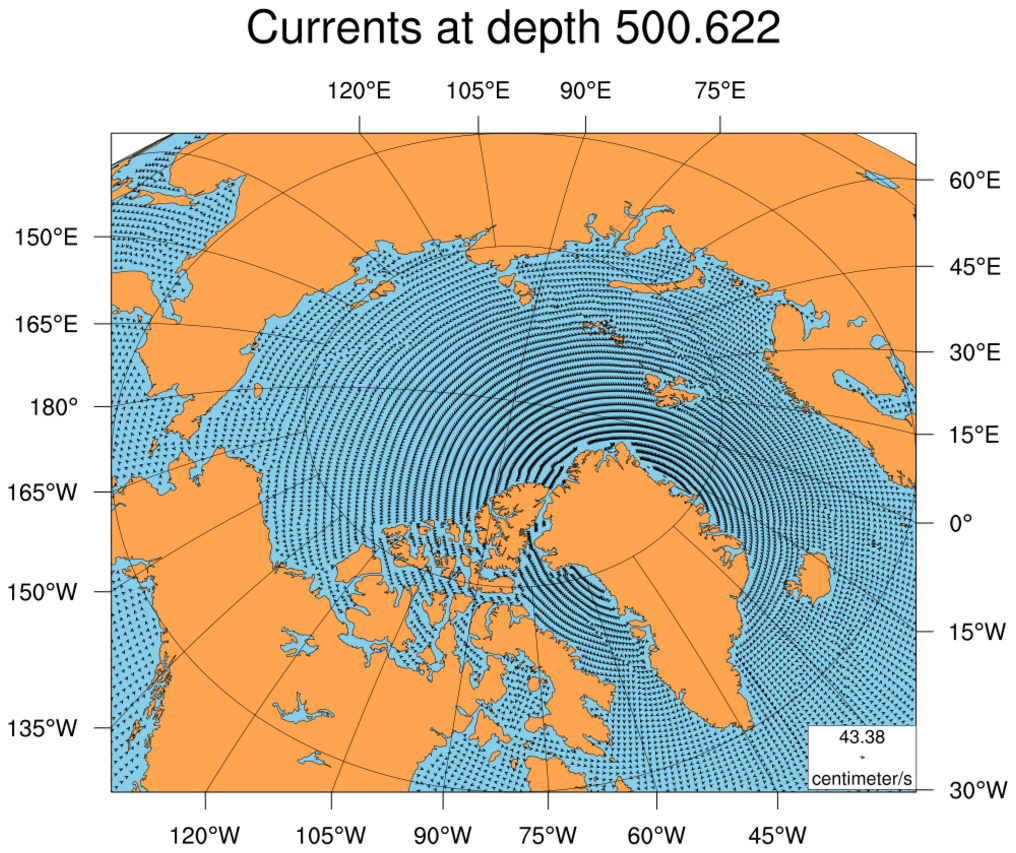
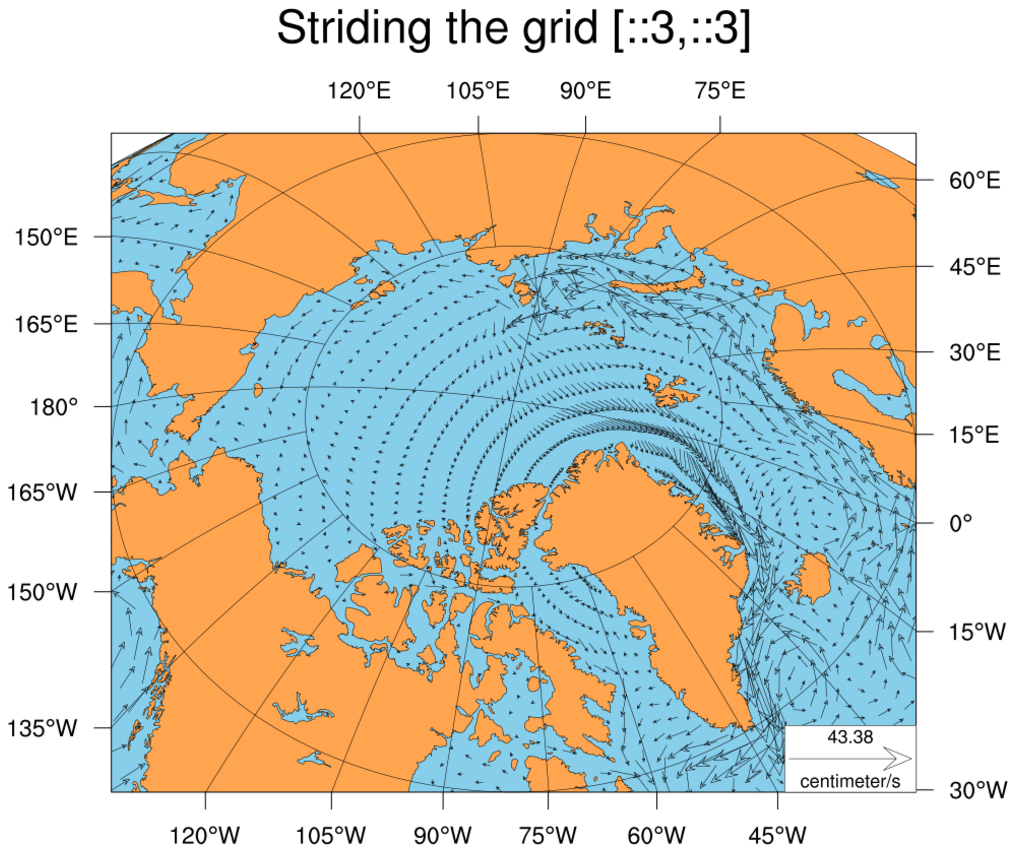
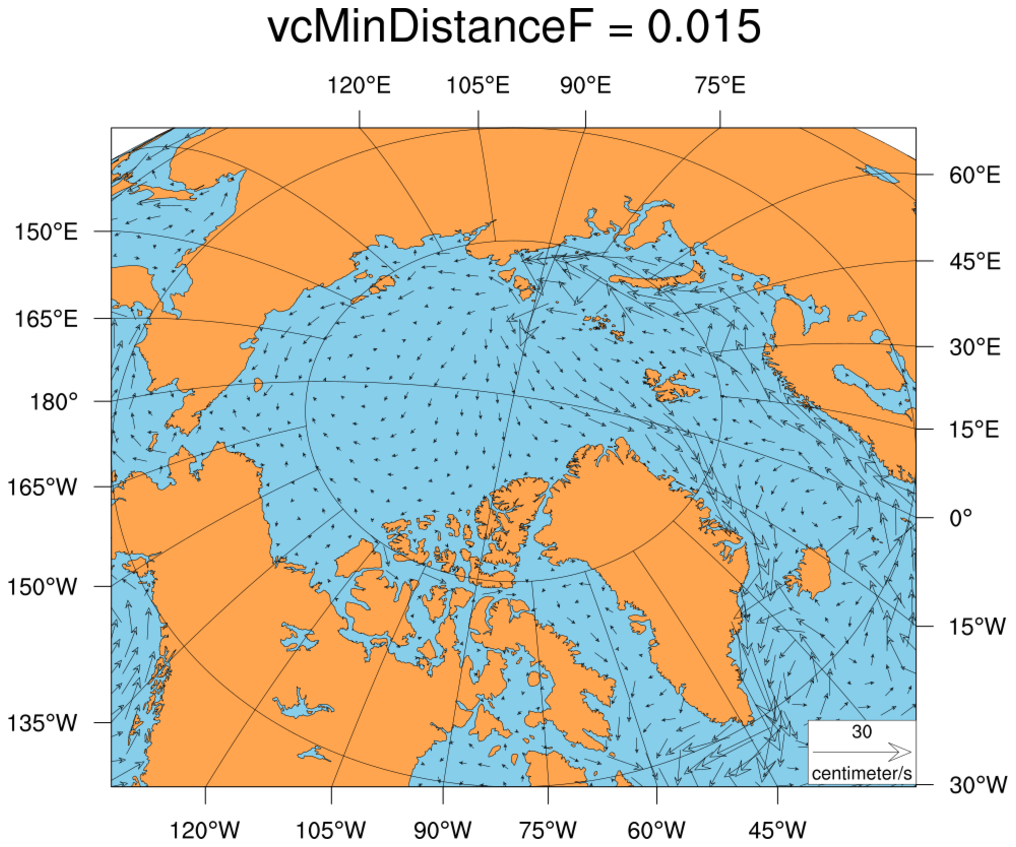
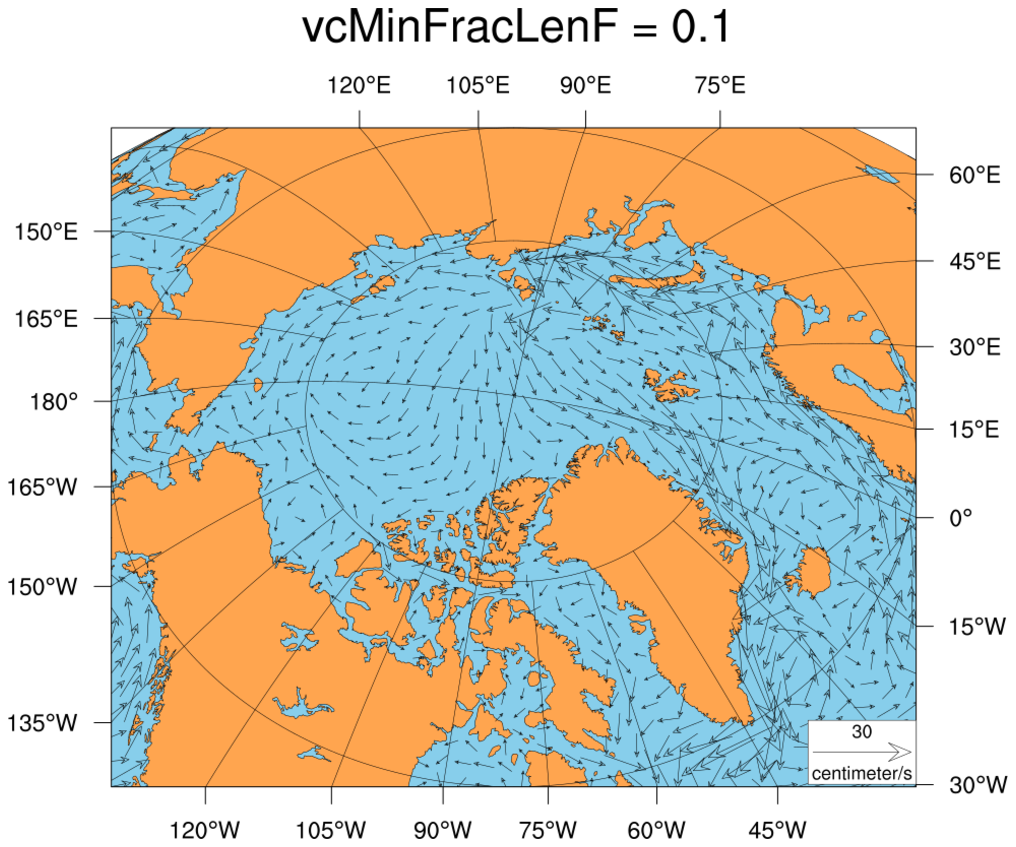
vector_pop.py
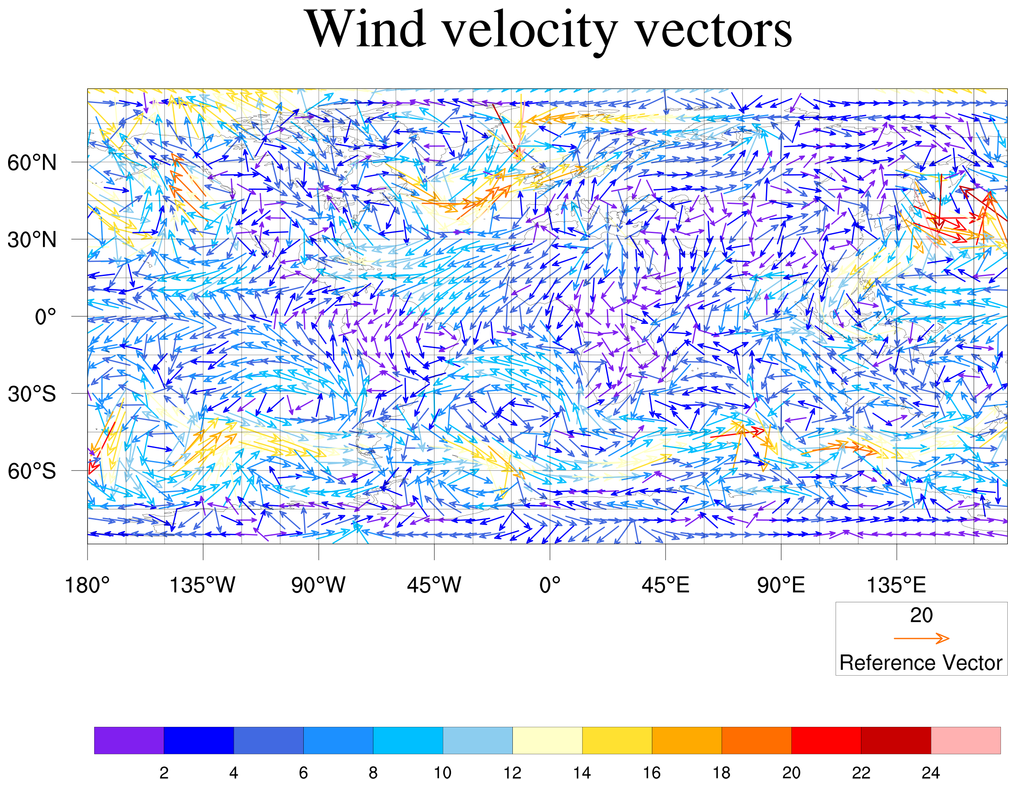
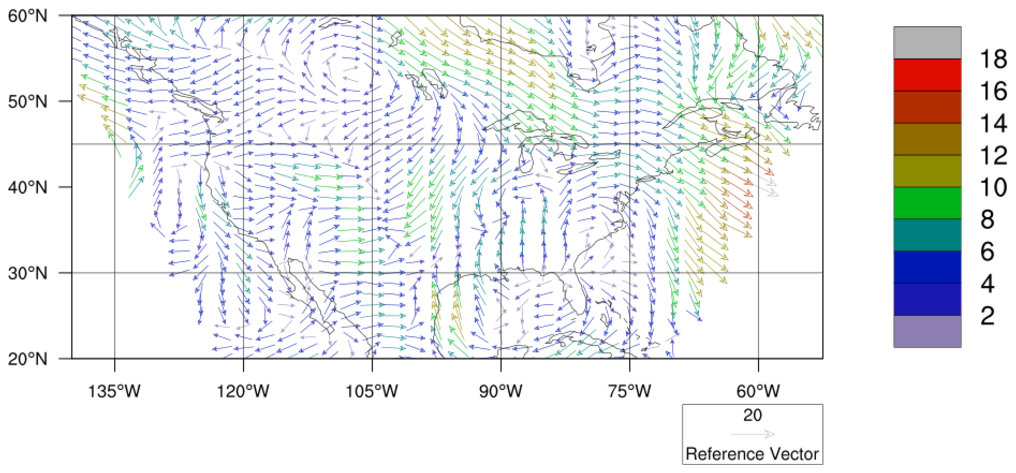
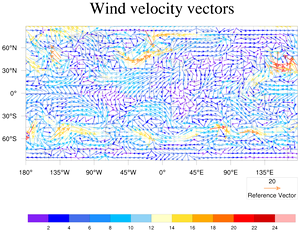
NUG_rectilinear_vector_PyNGL.py

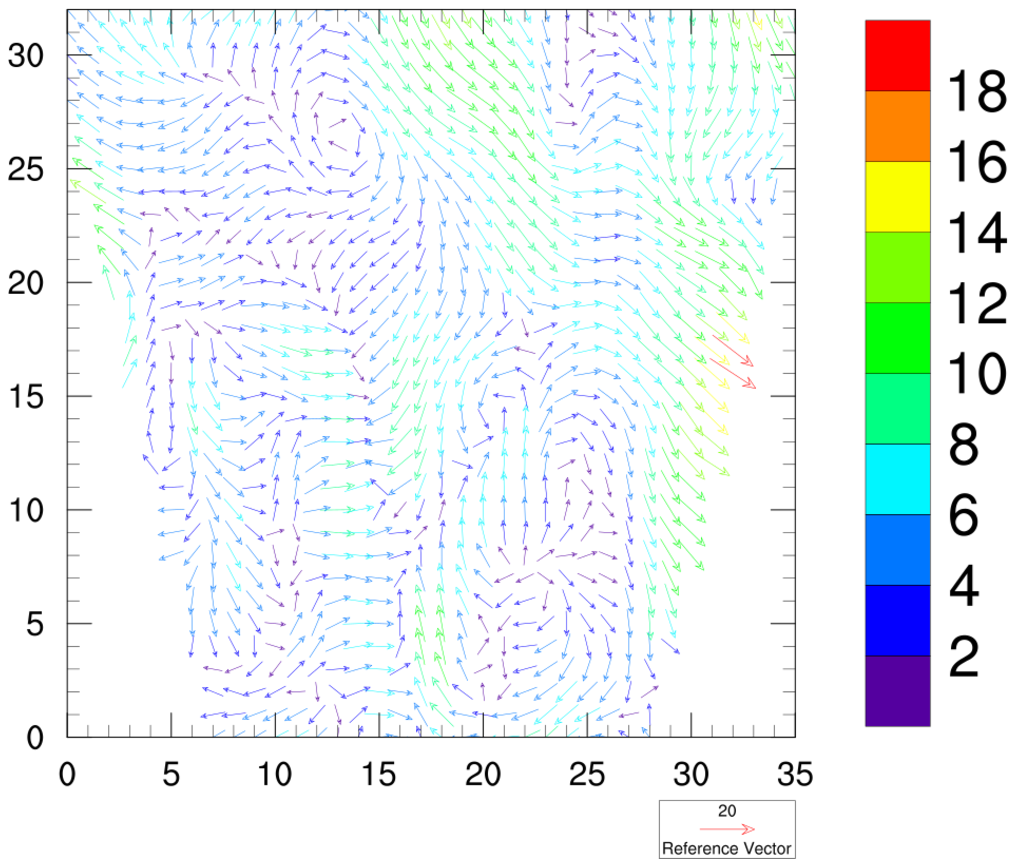
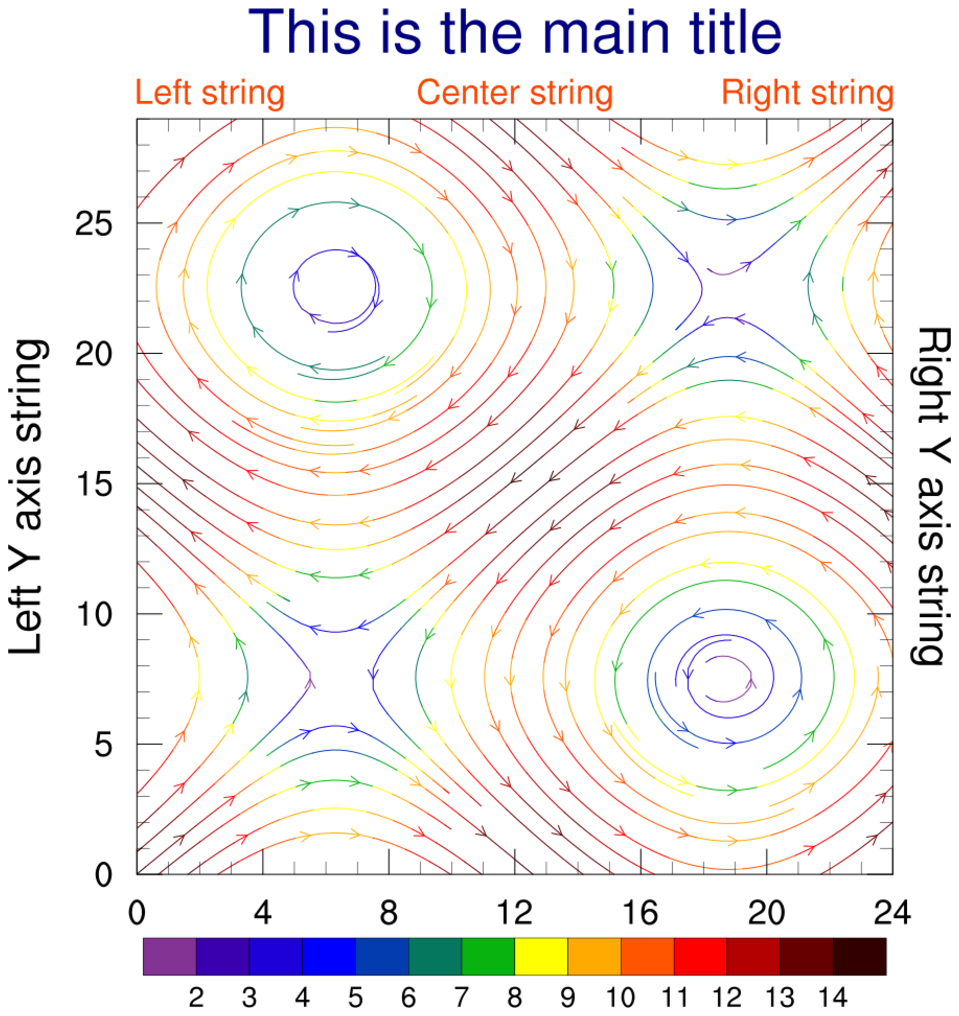
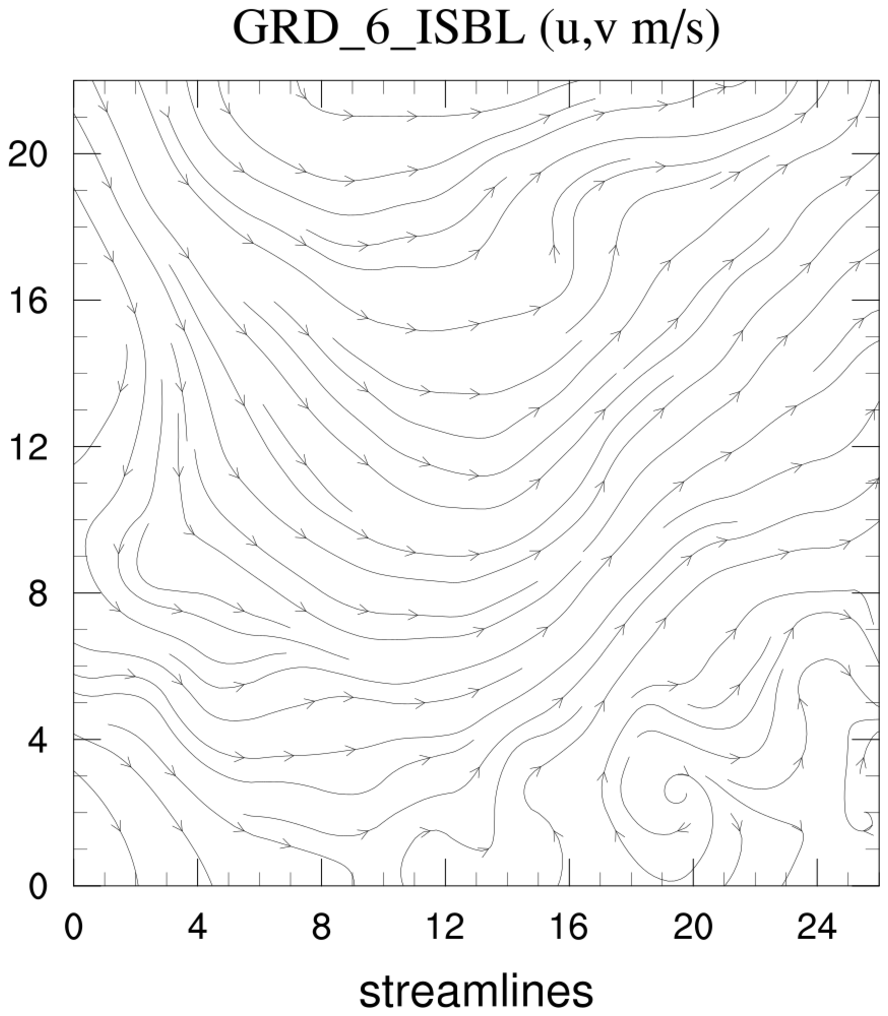
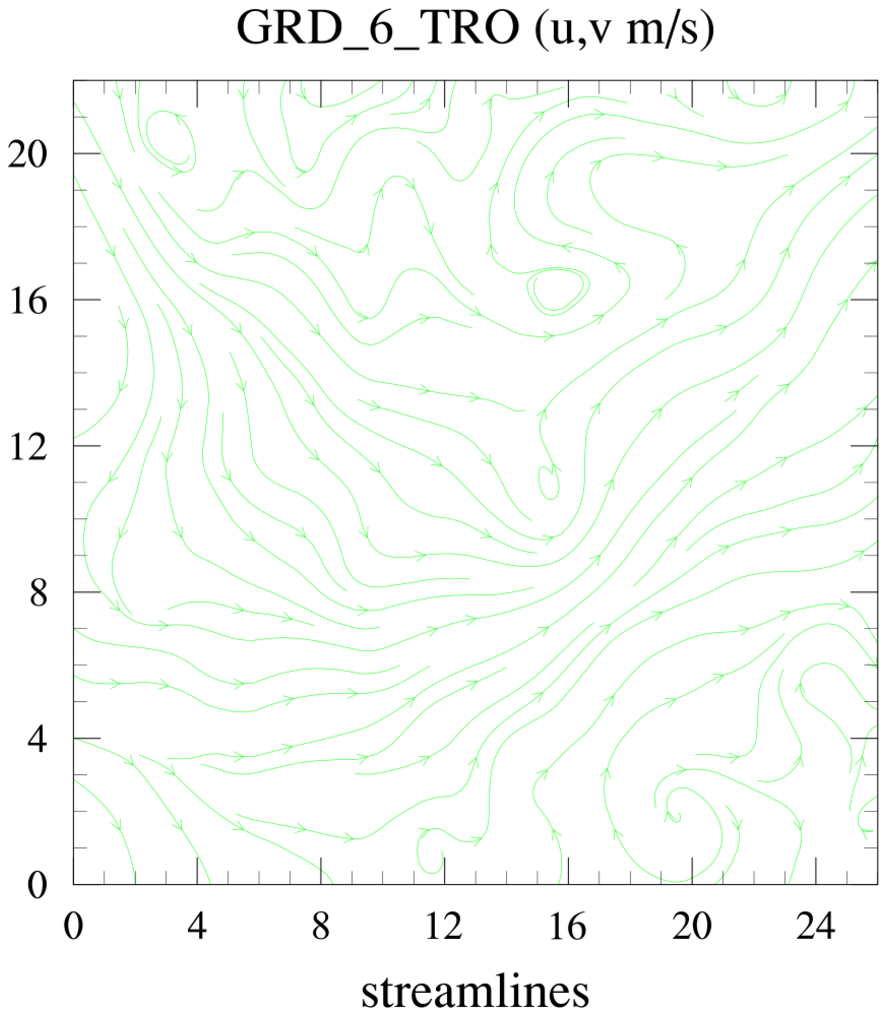
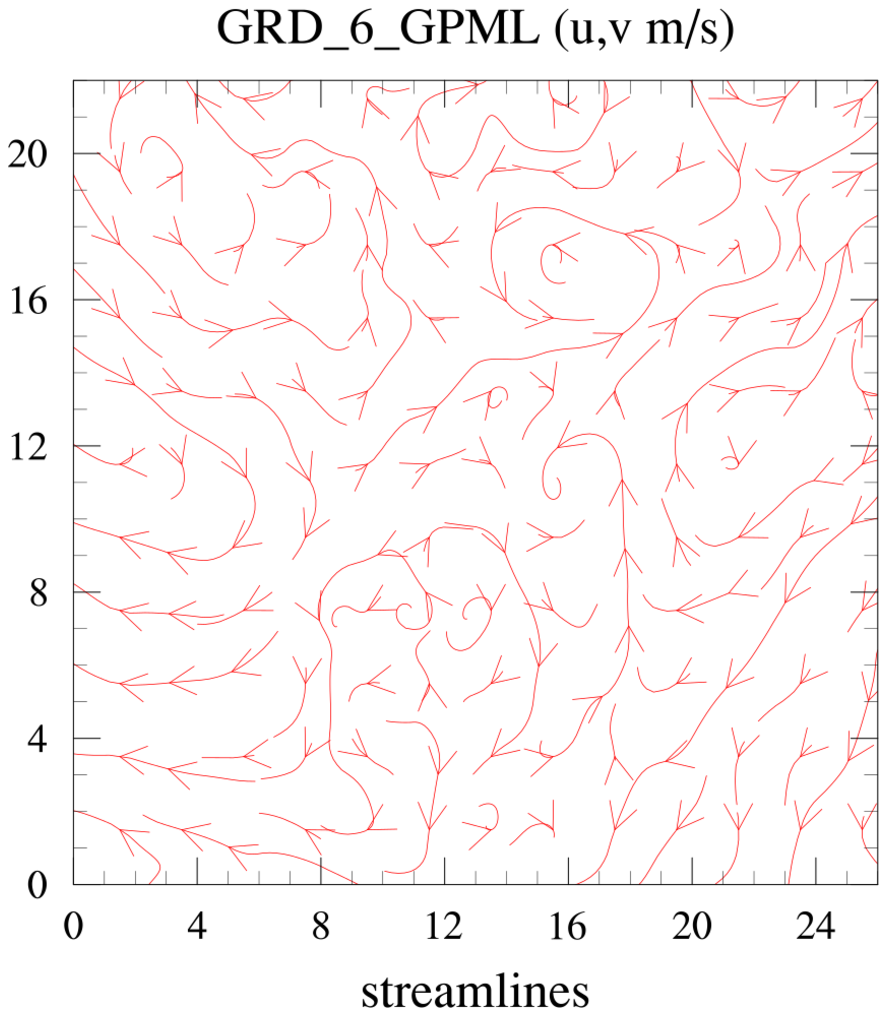
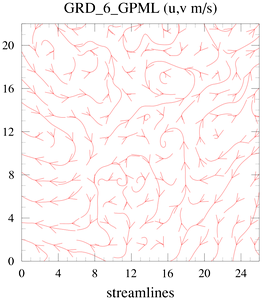
Basic streamline plots
streamline3.py

ngl04p.py
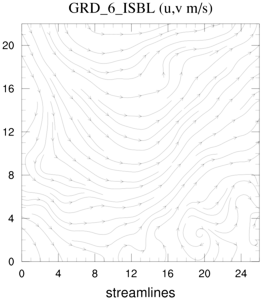
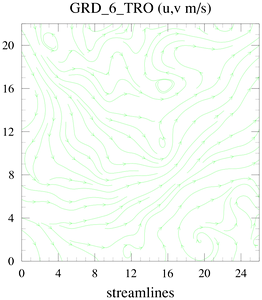
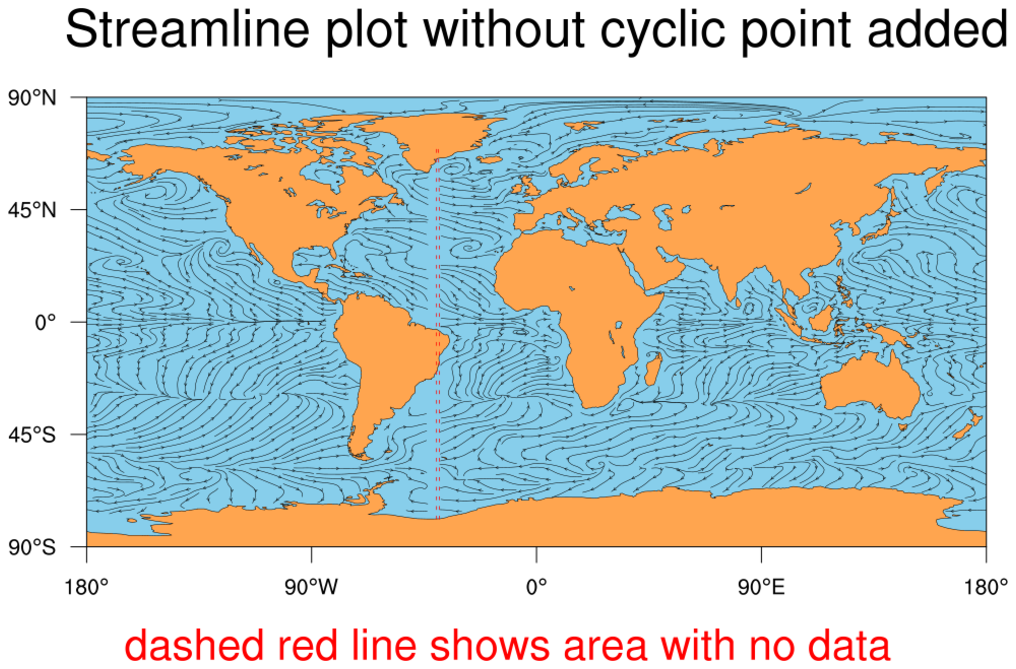
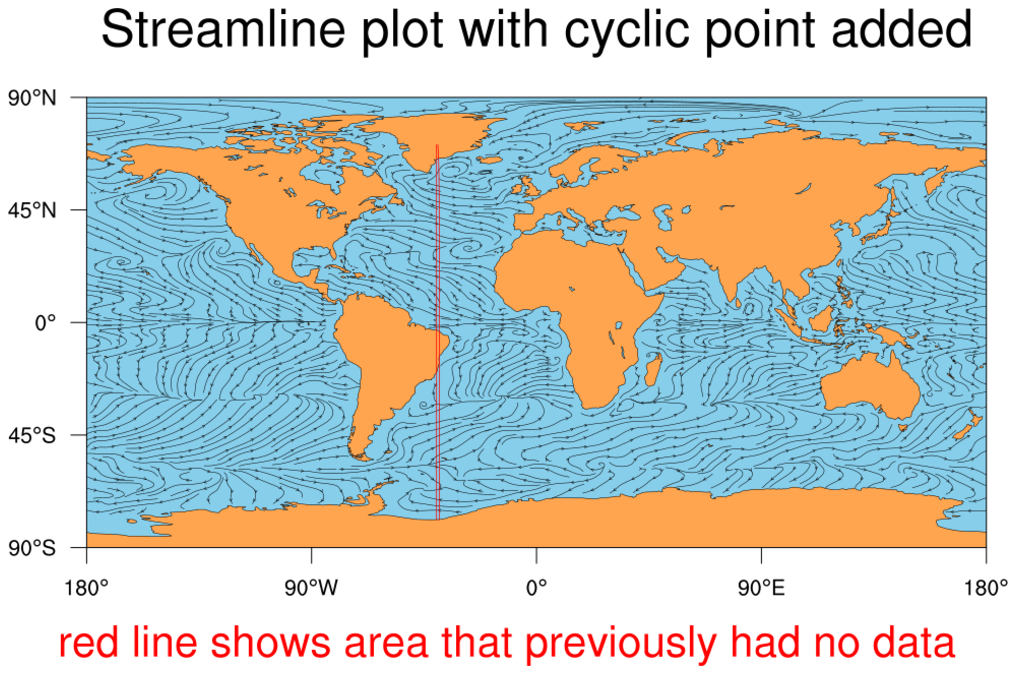
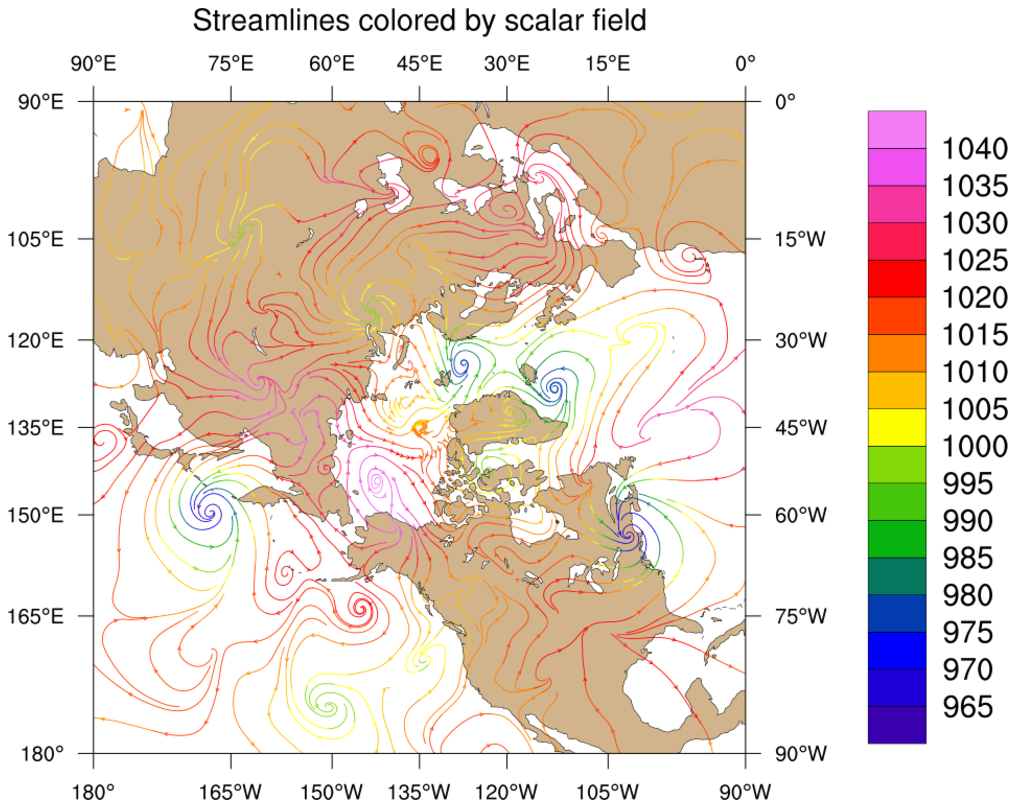
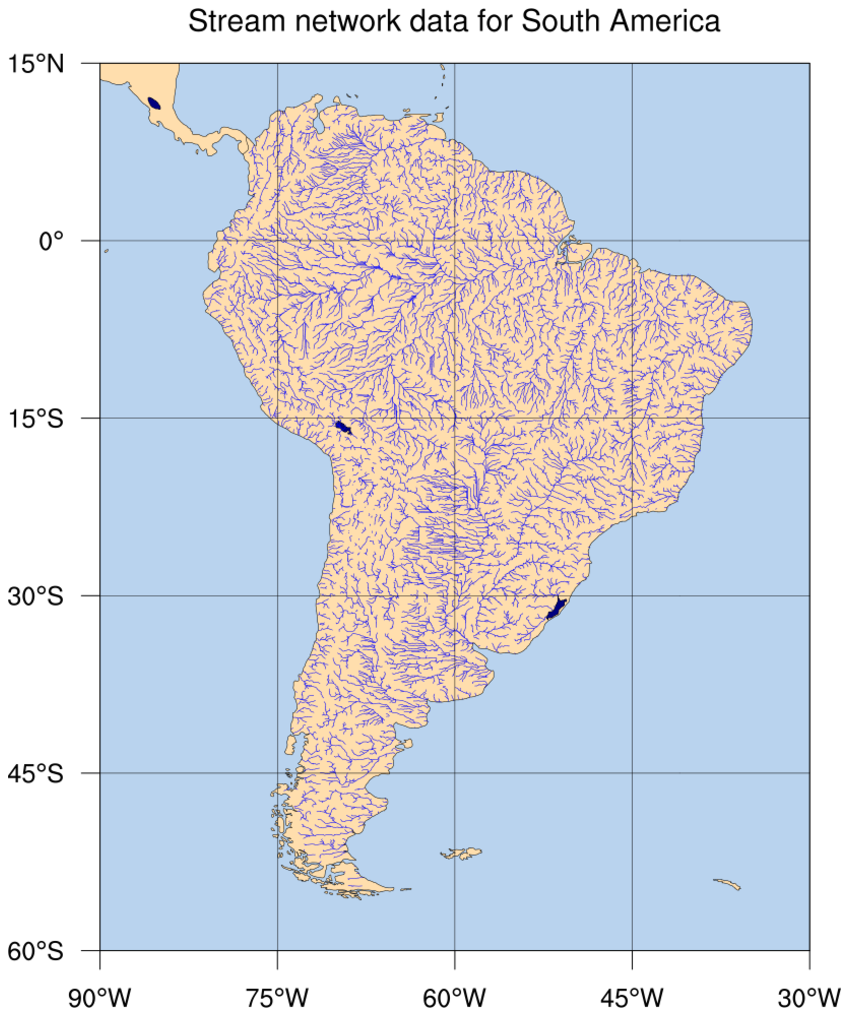
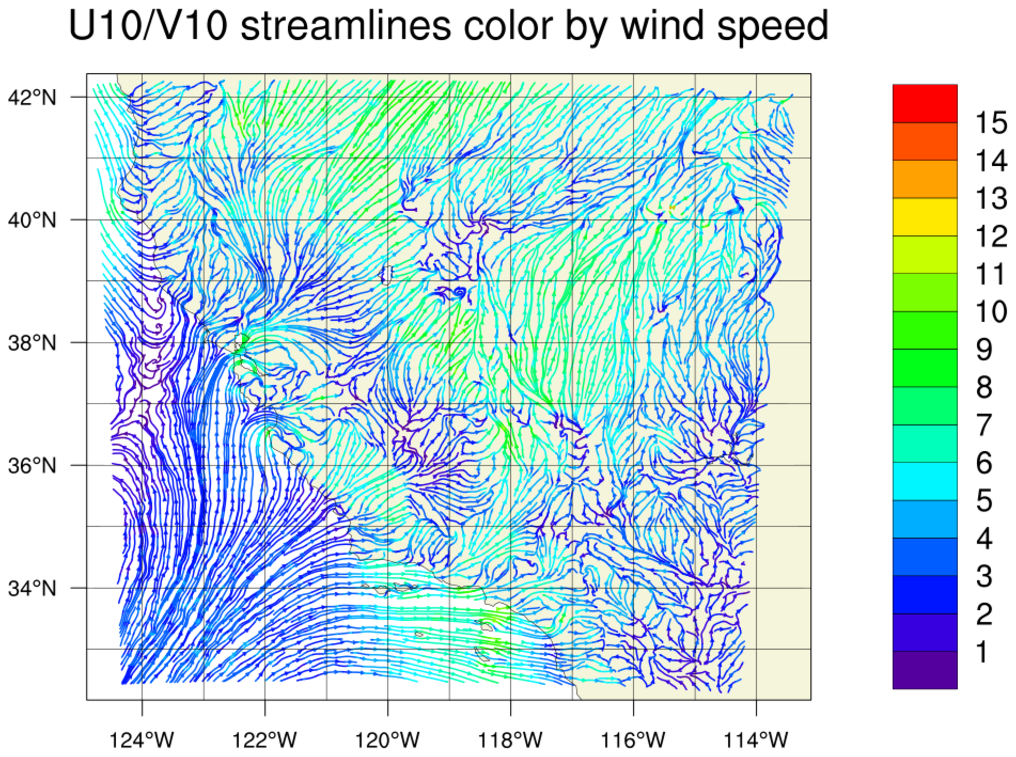
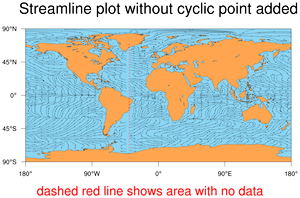
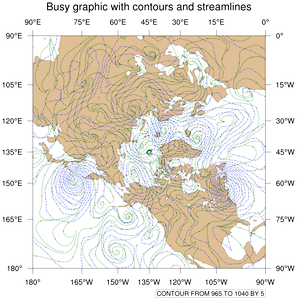
Streamlines over maps
streamline1.py

streamline2.py

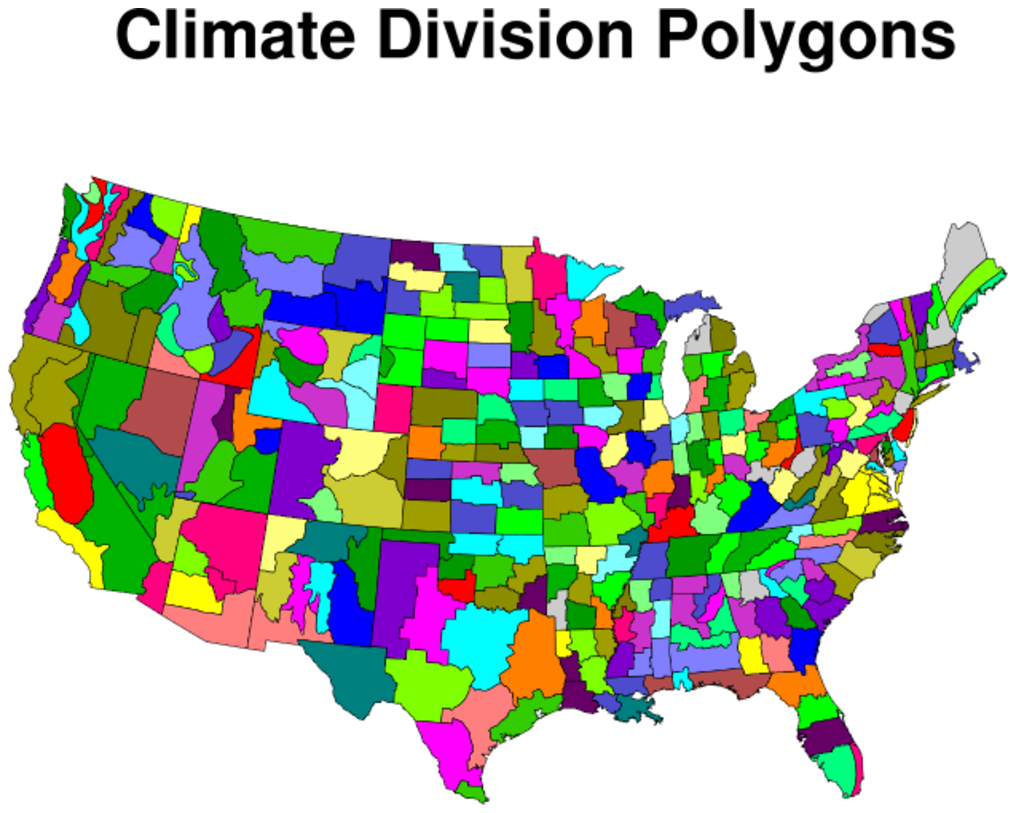
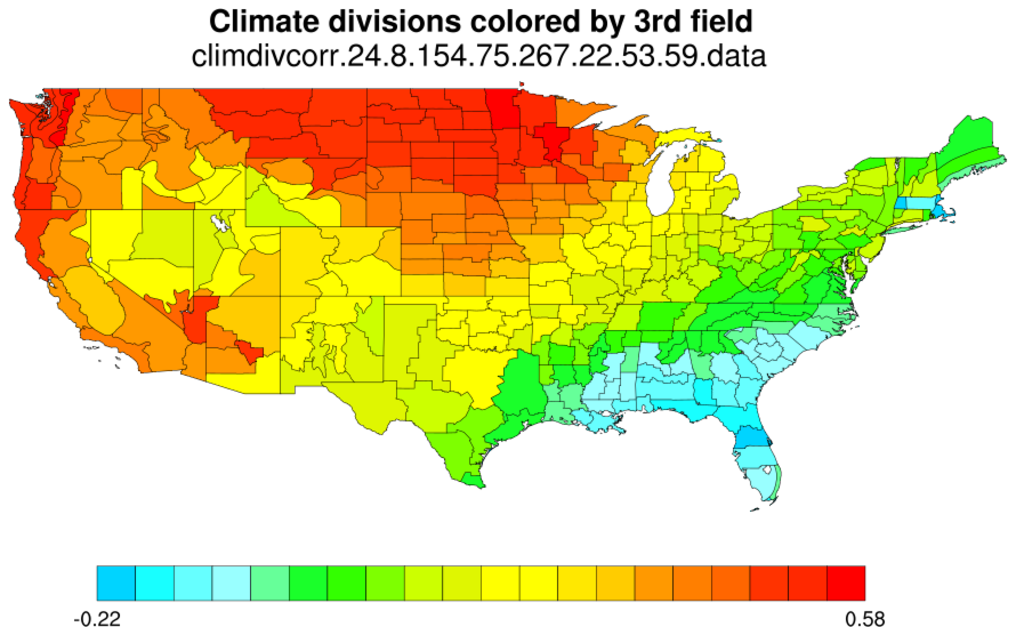
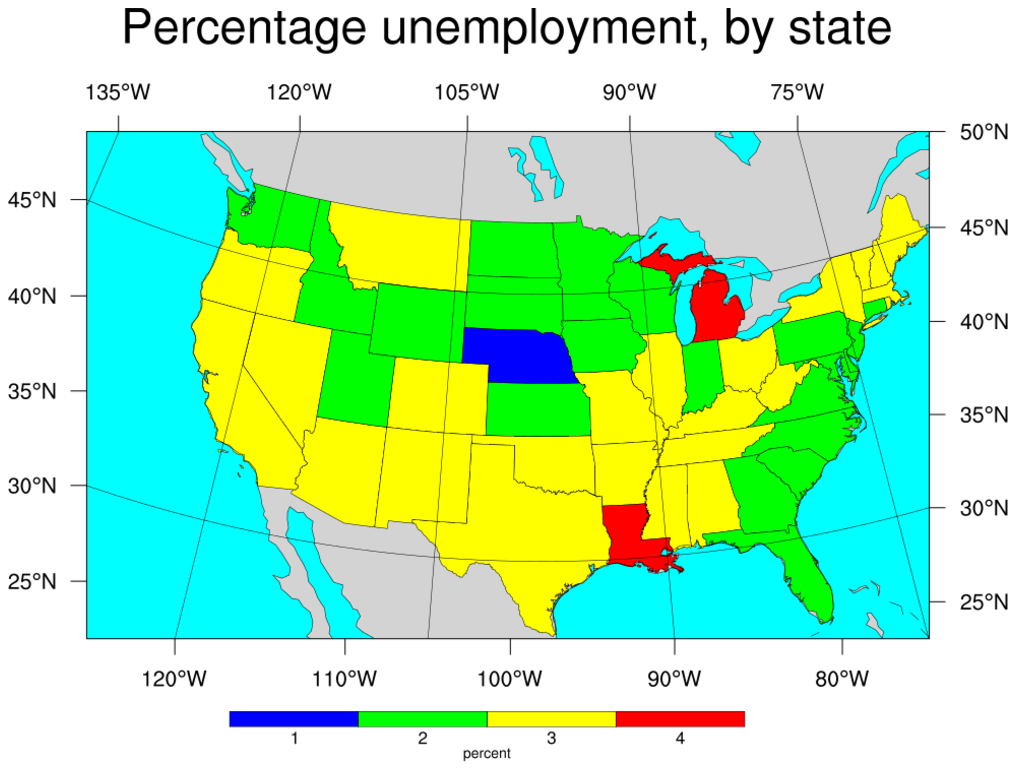
Maps only
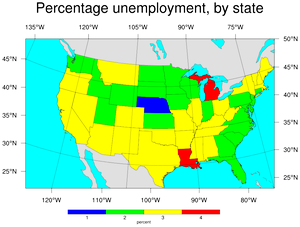
clmdiv1.py

clmdiv2.py

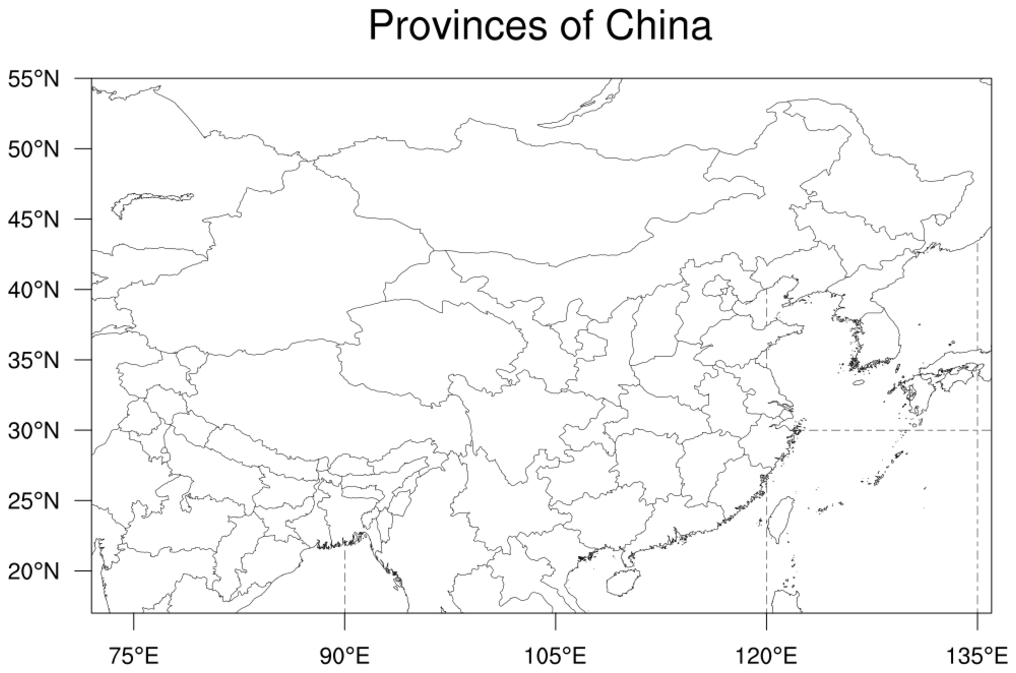
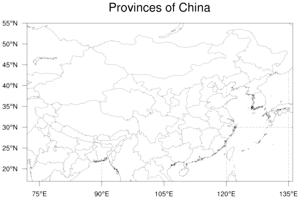
ctrydiv1.py
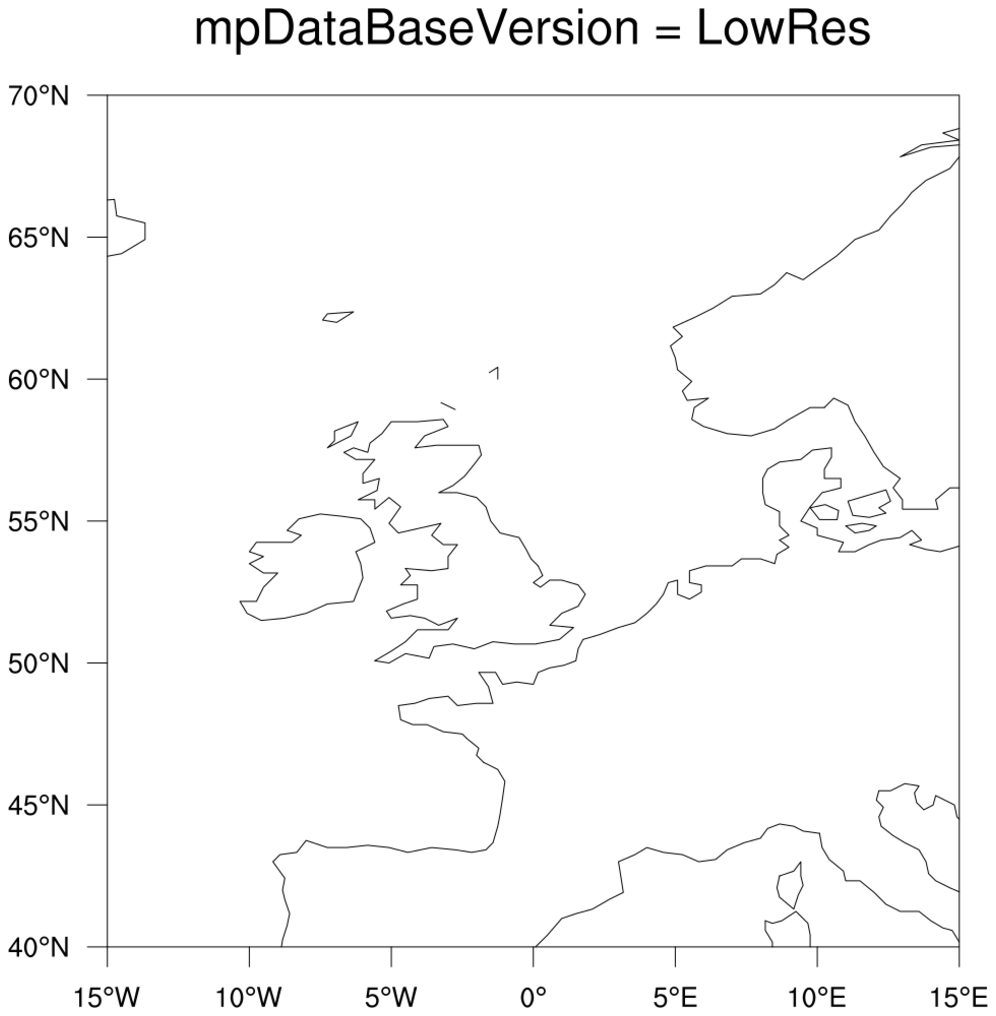
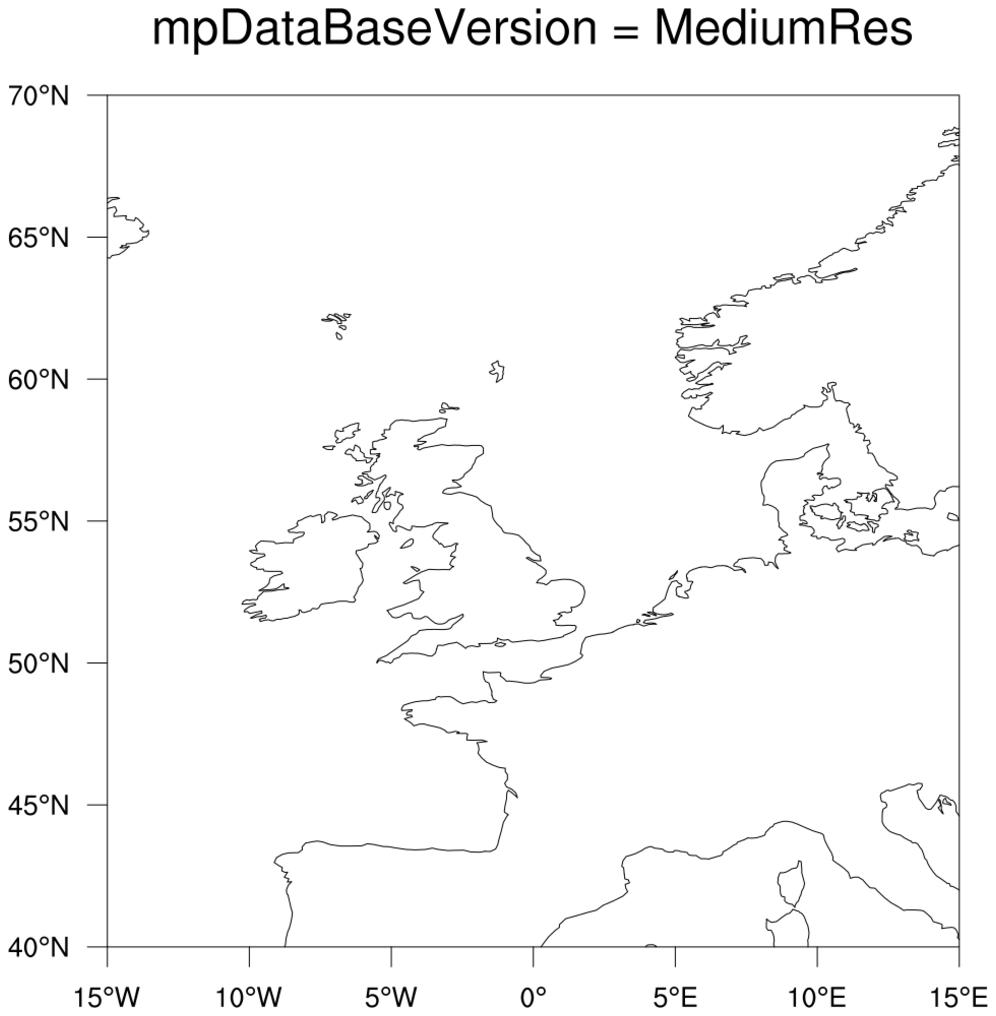
coast1.py
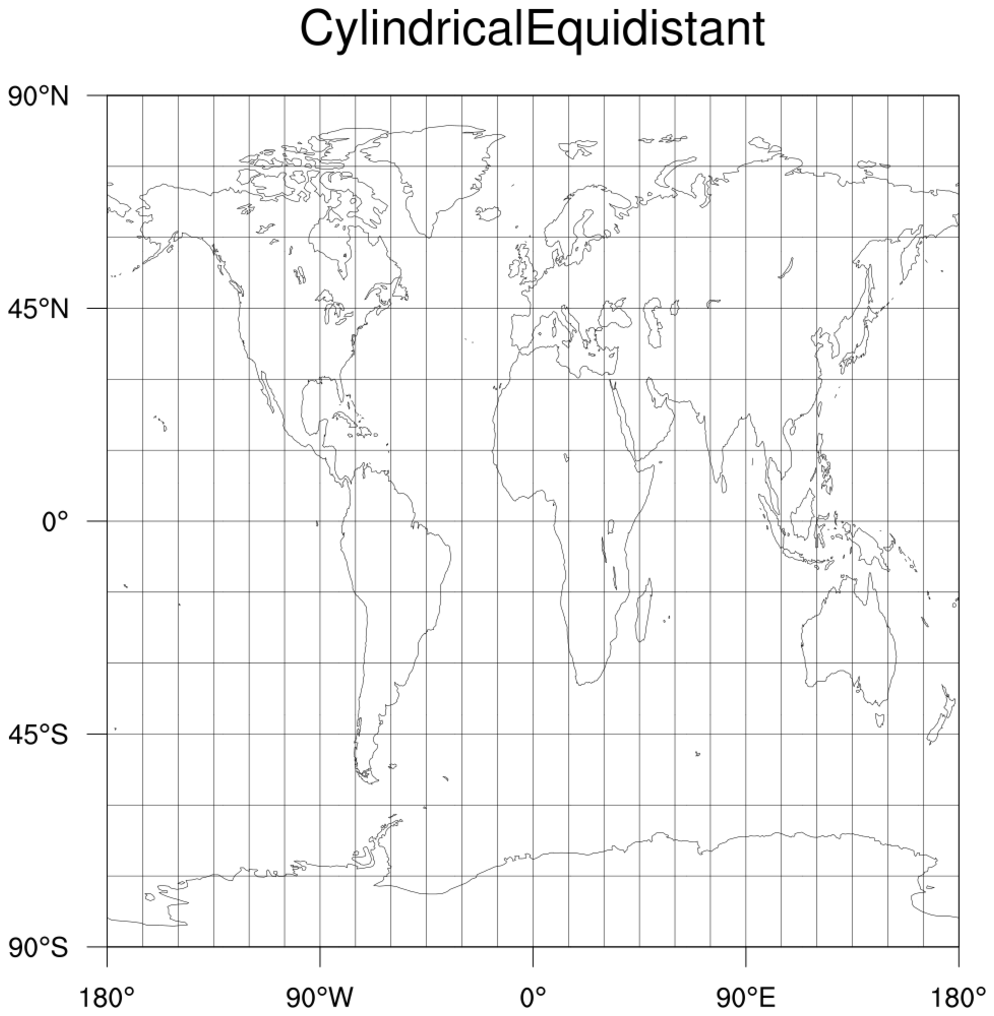
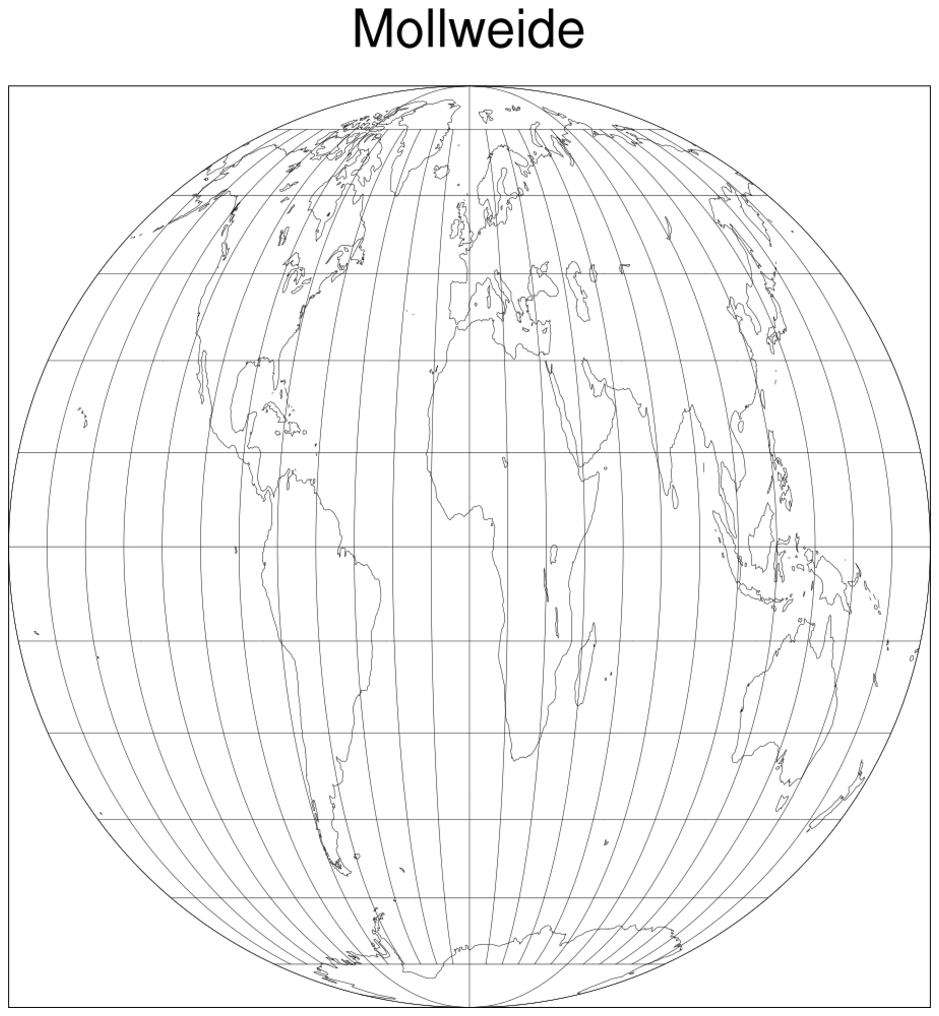
map1.py
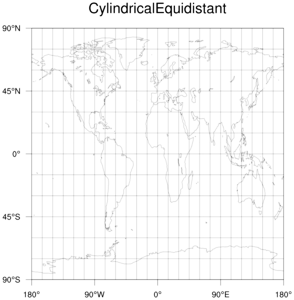
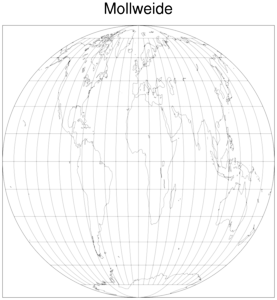
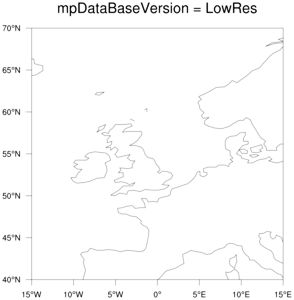
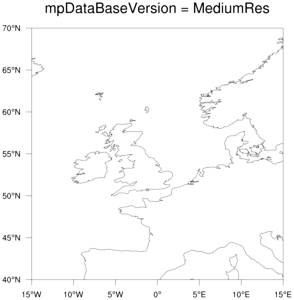
map2.py
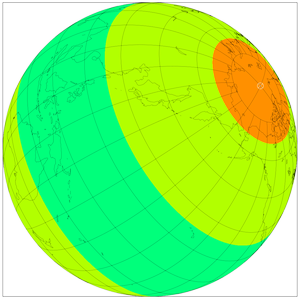
map3.py
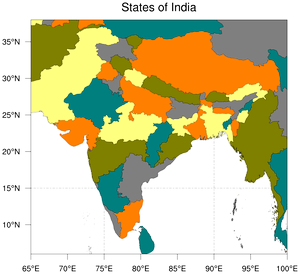
shapefile1.py
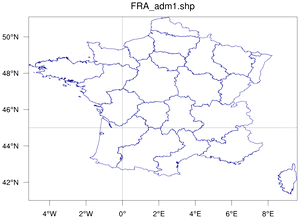
shapefile2.py
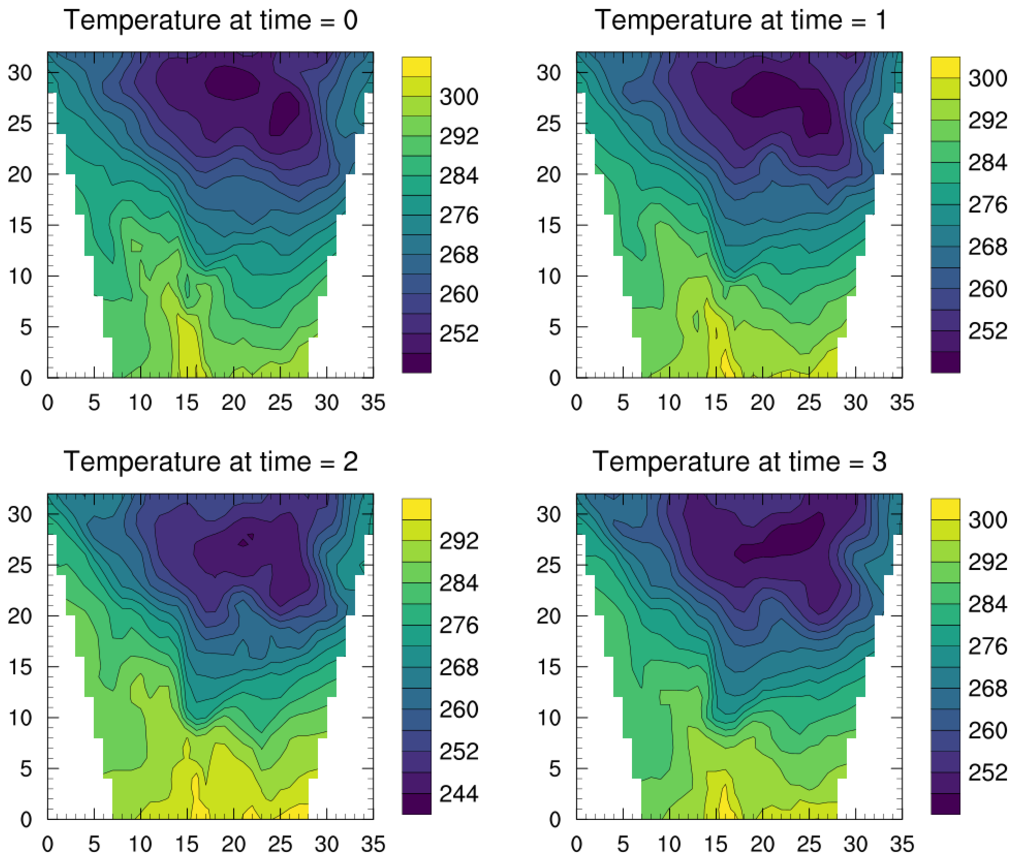
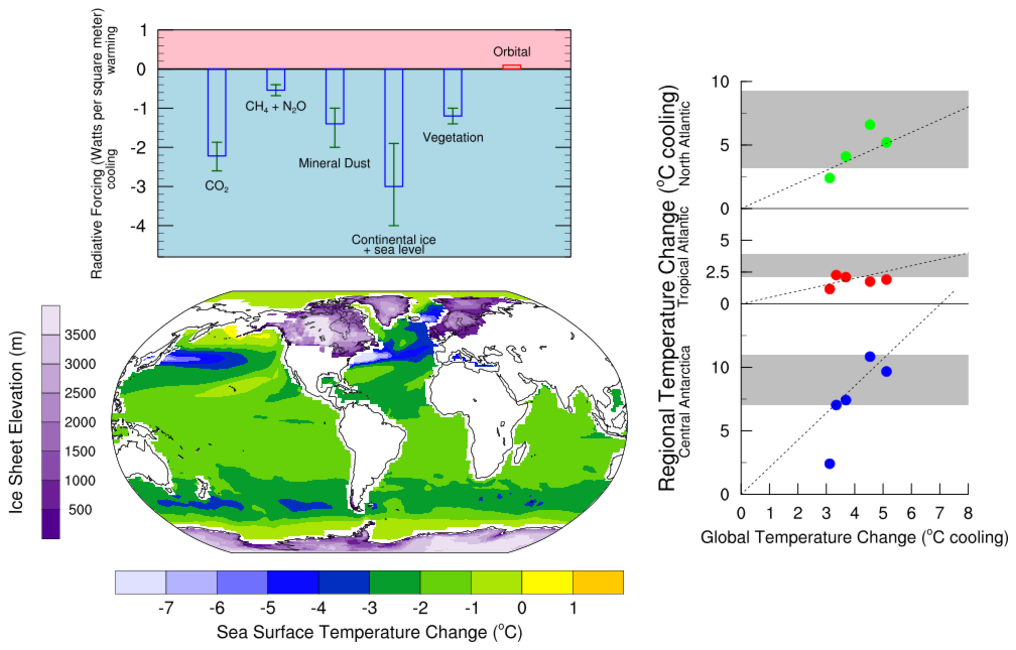
Multiple plots on a page (paneling)
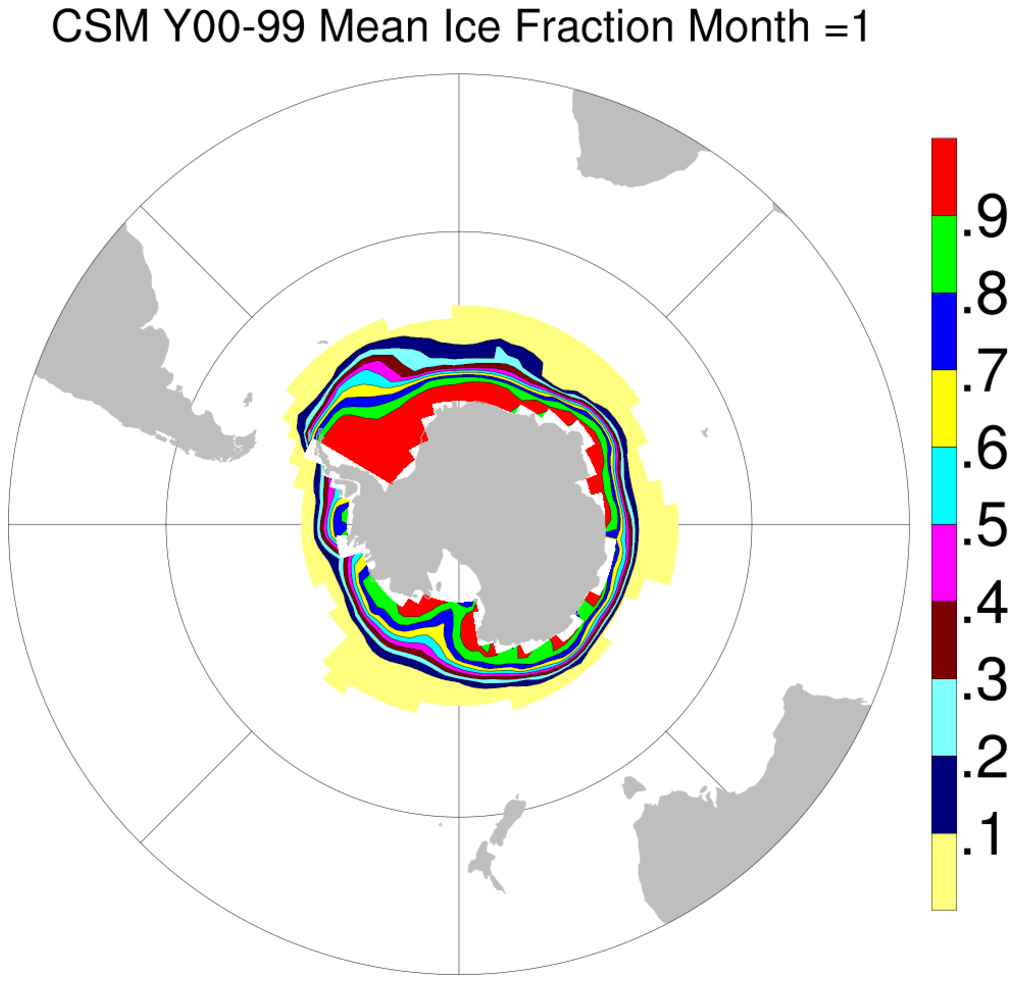
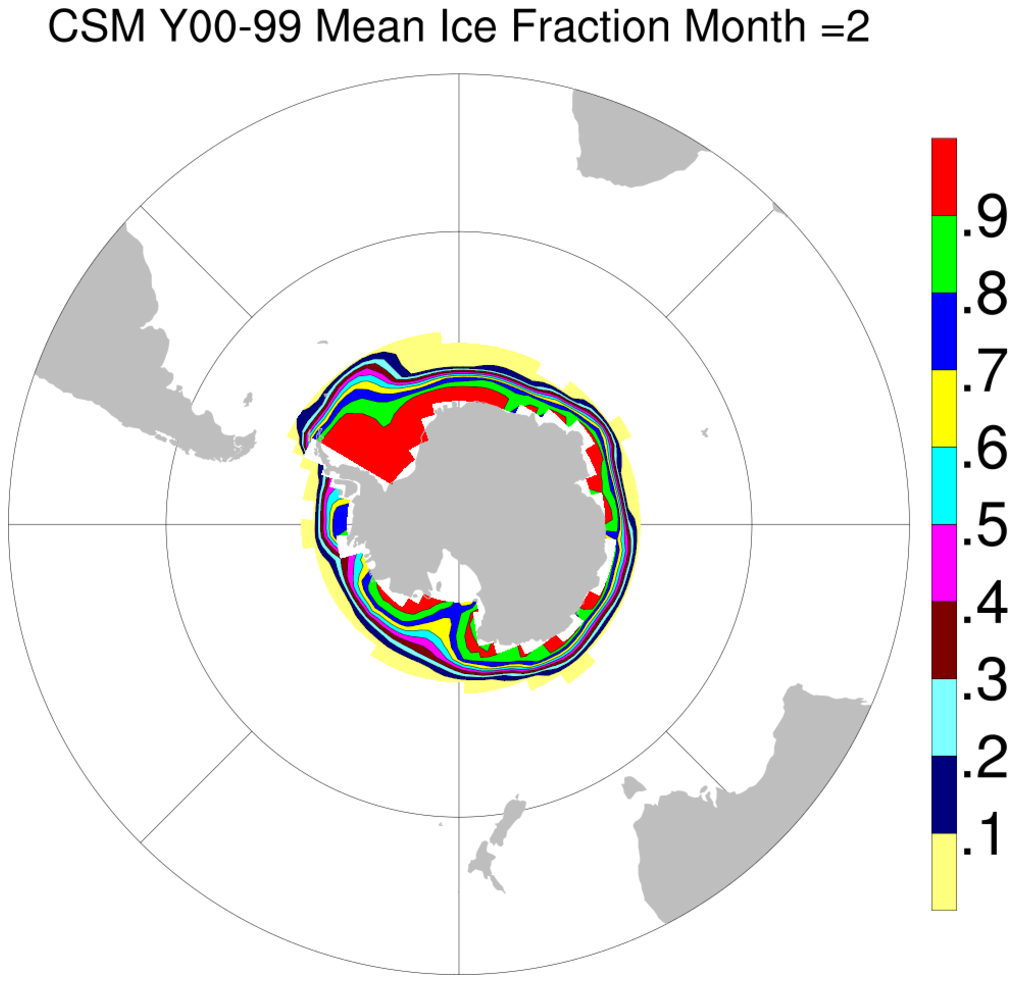
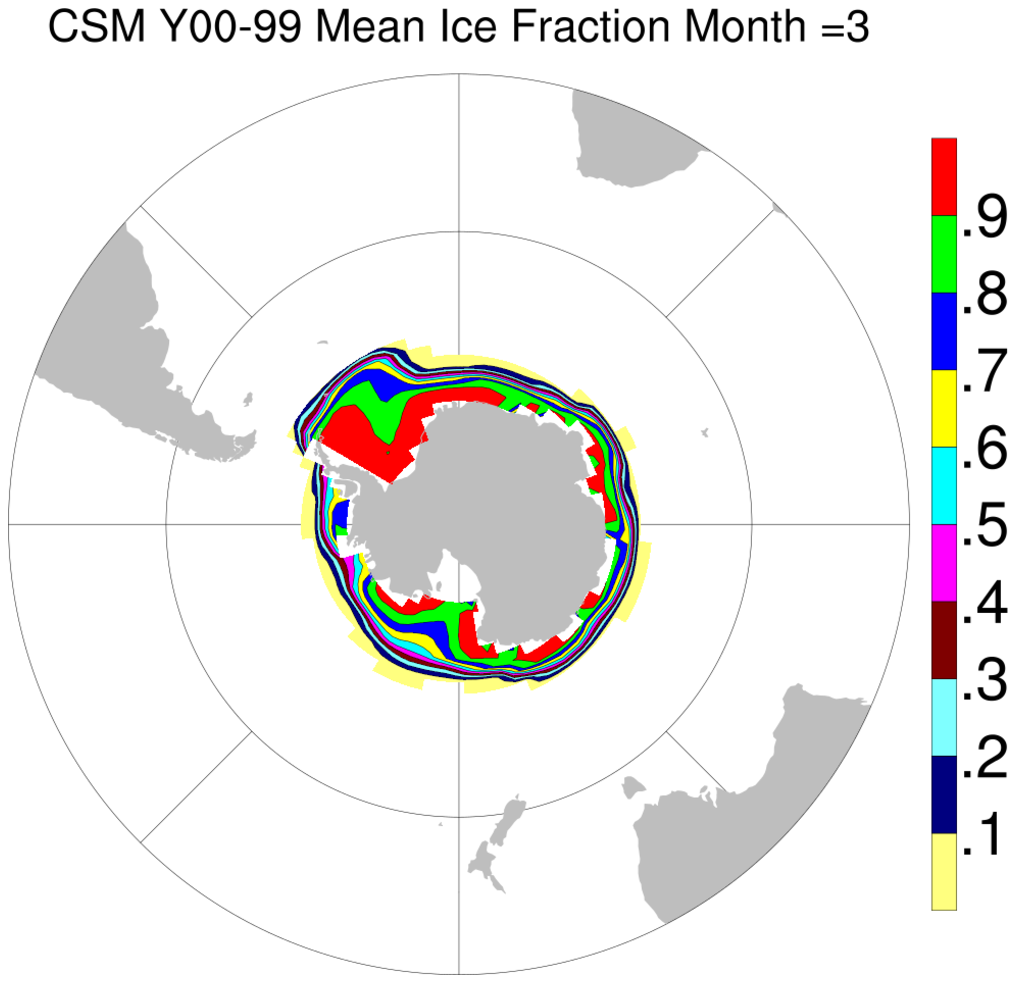
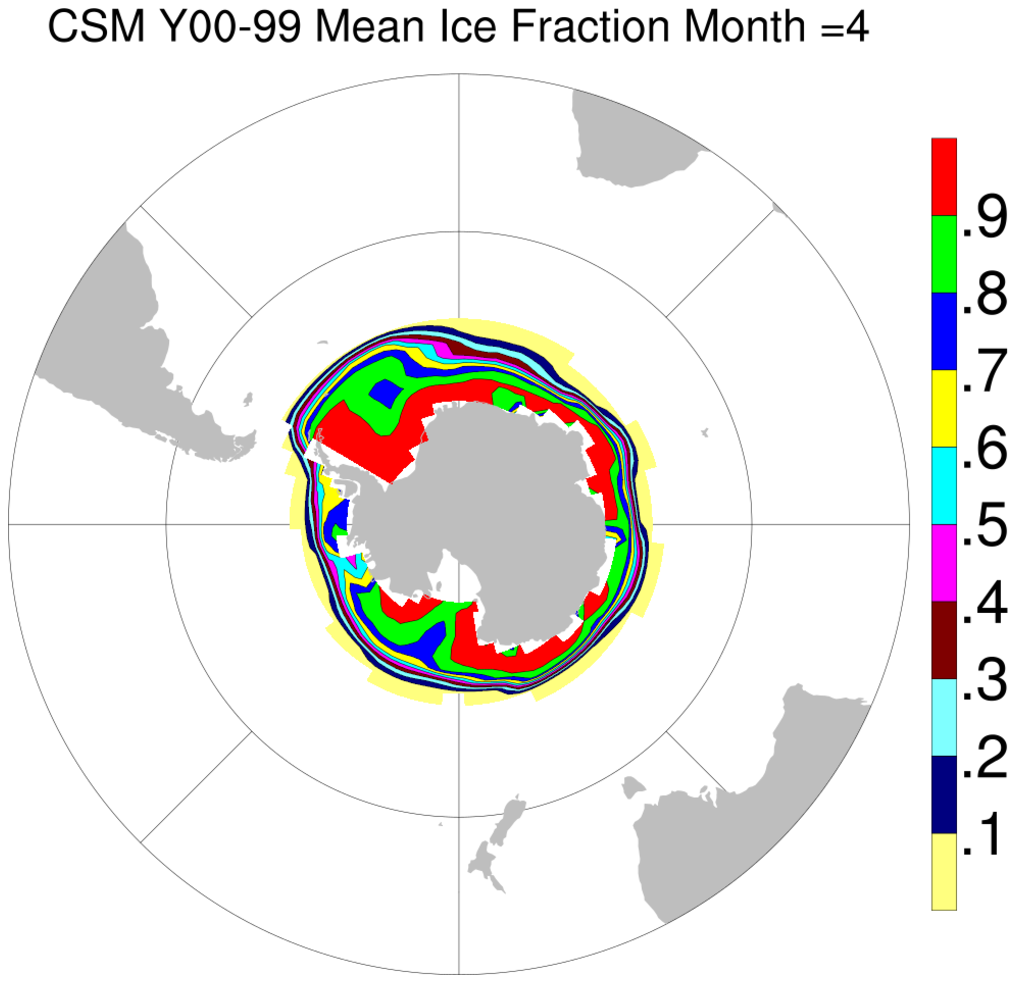
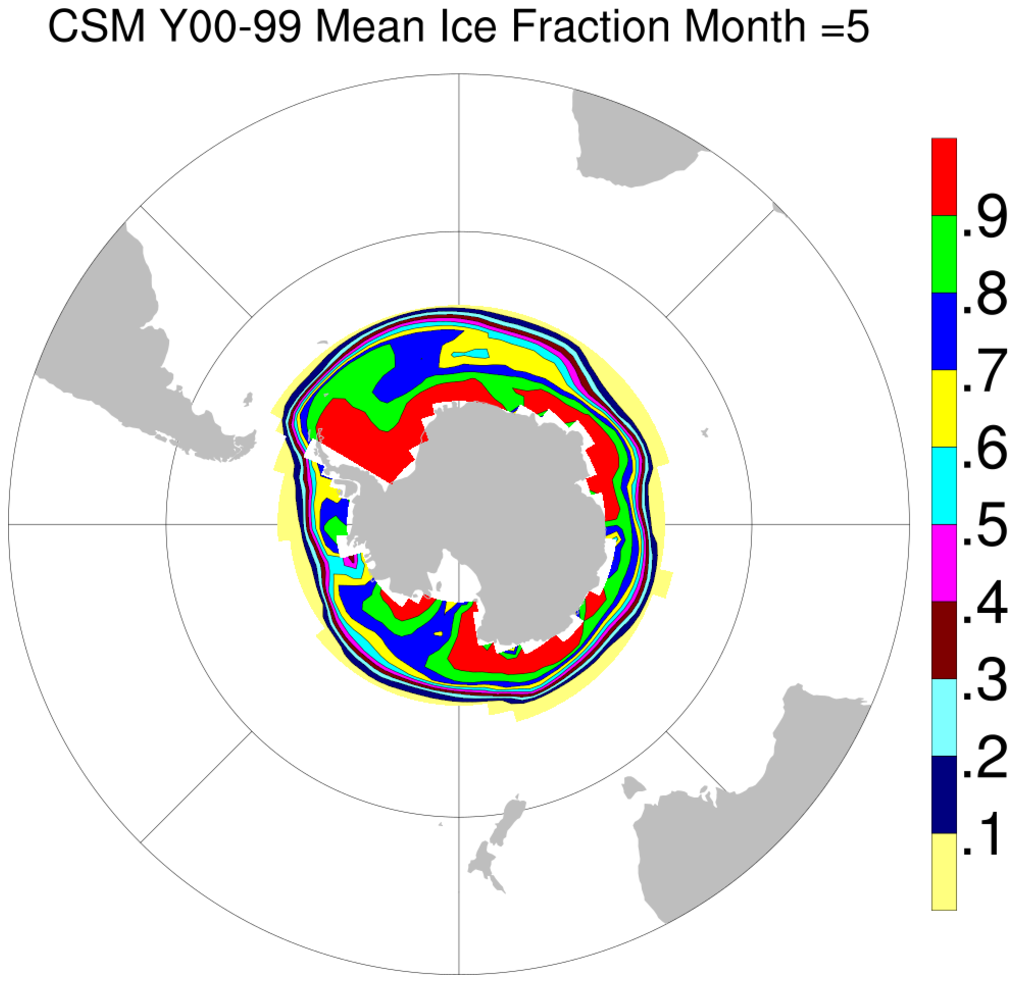
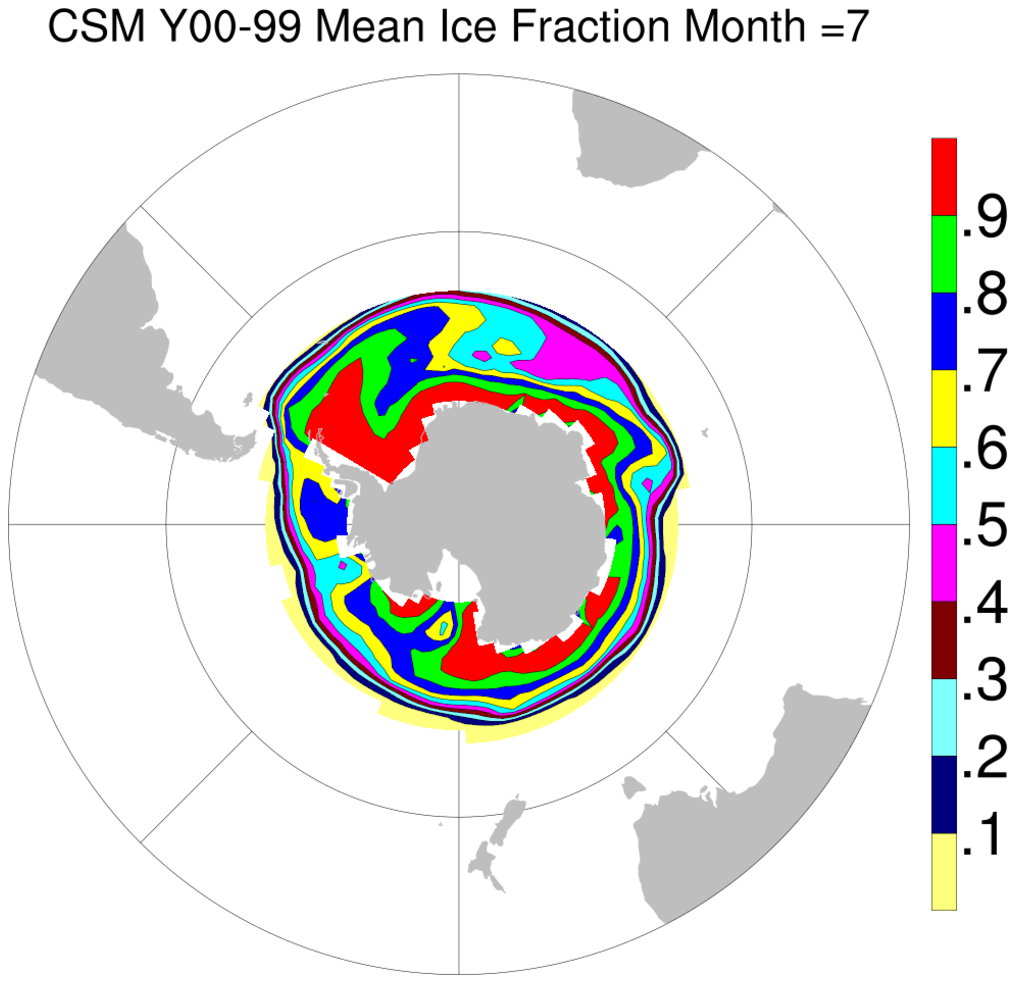
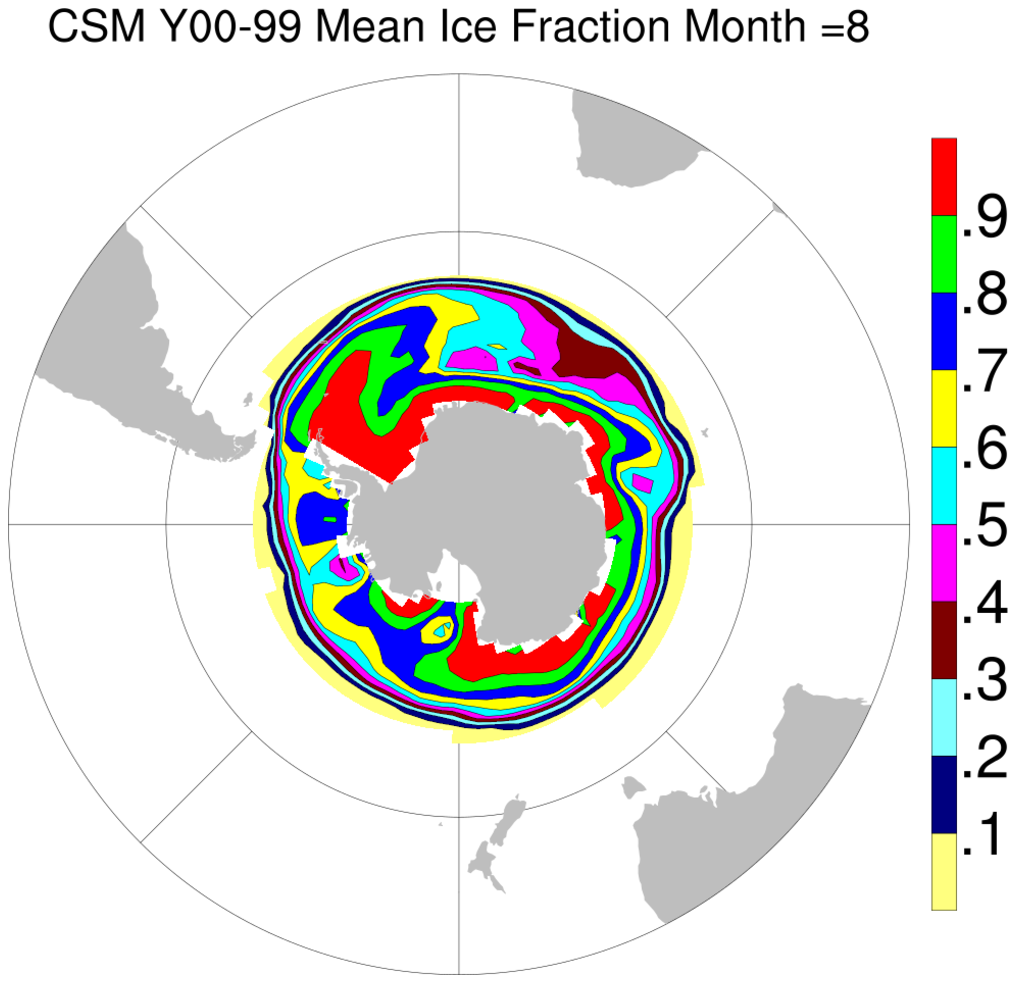
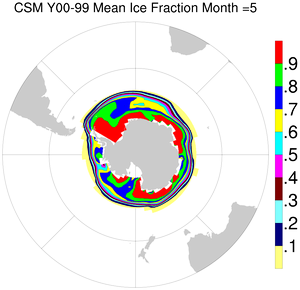
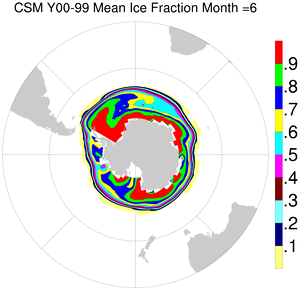
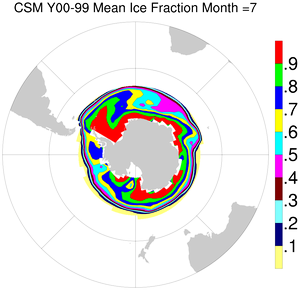
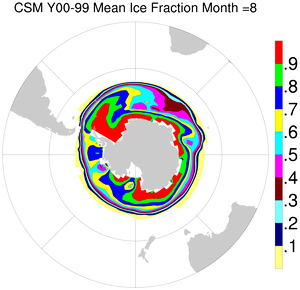
panel1.py
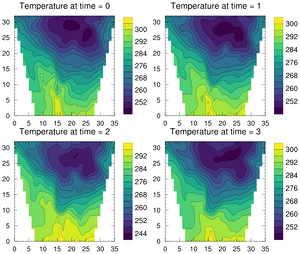
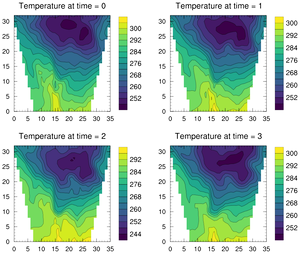
panel2.py
multi_plot.py
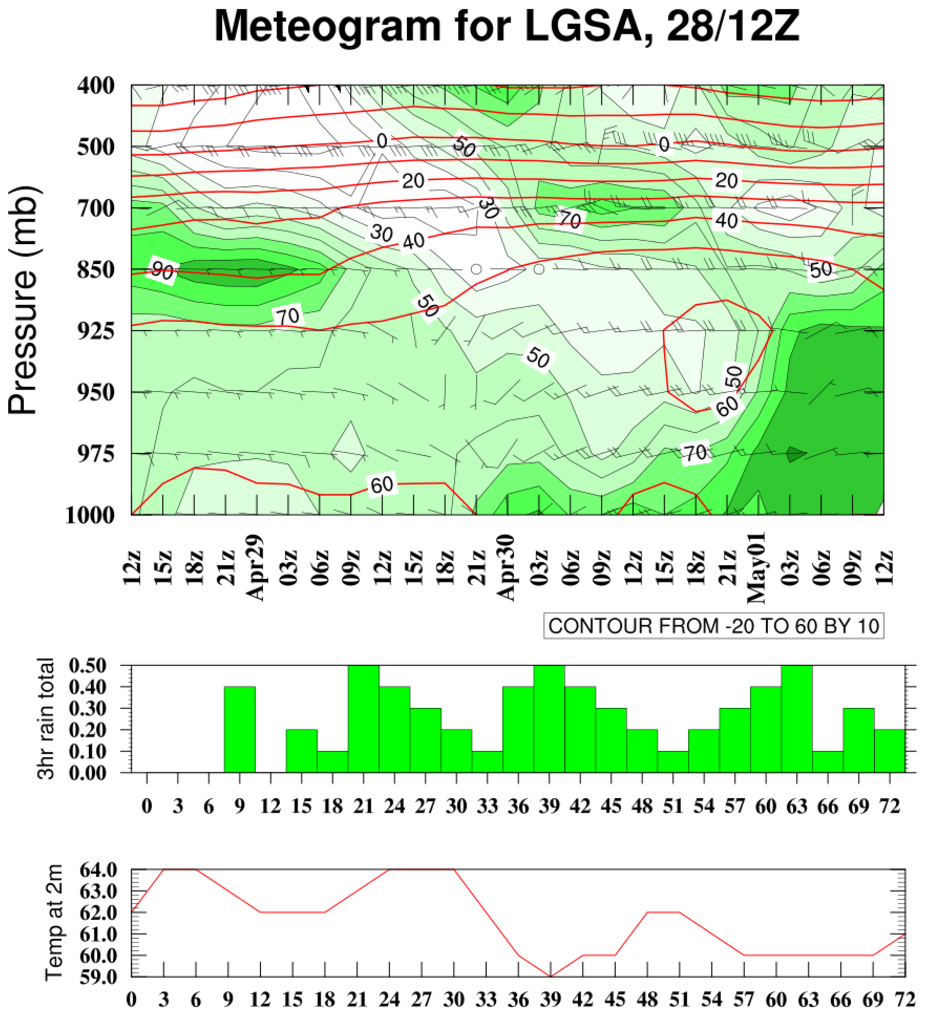
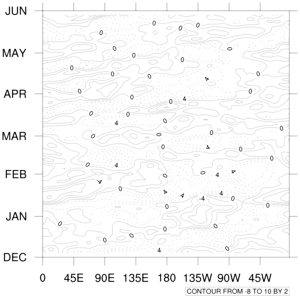
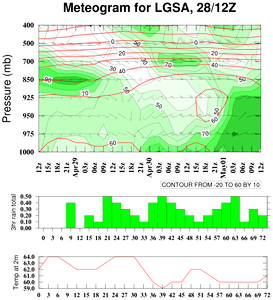
meteogram.py
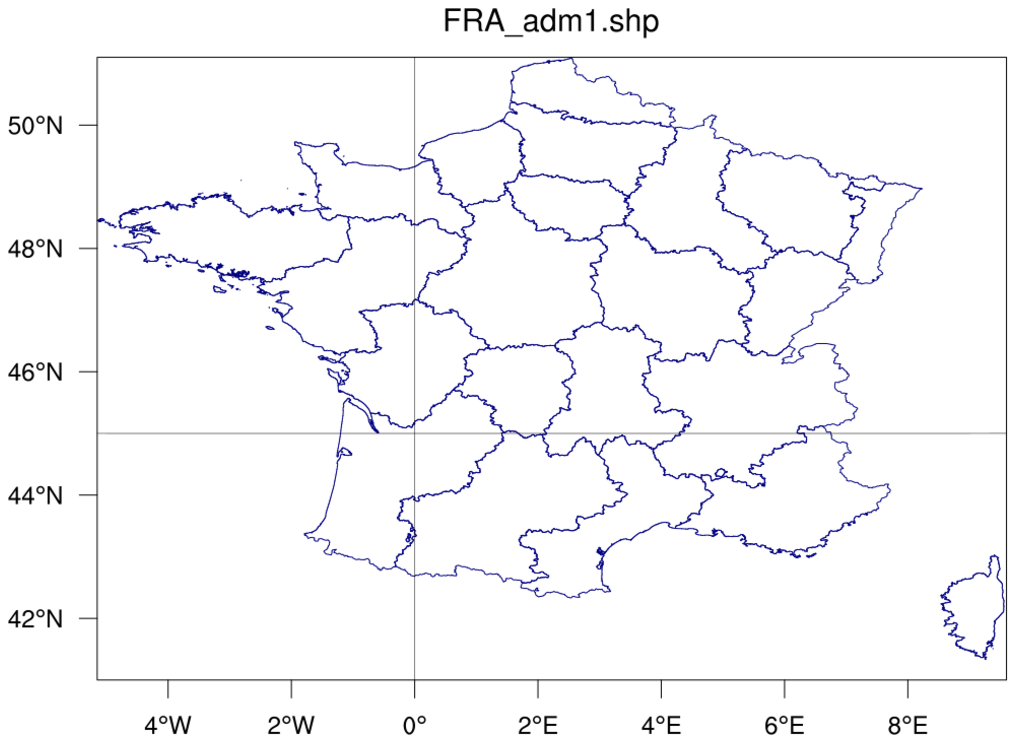
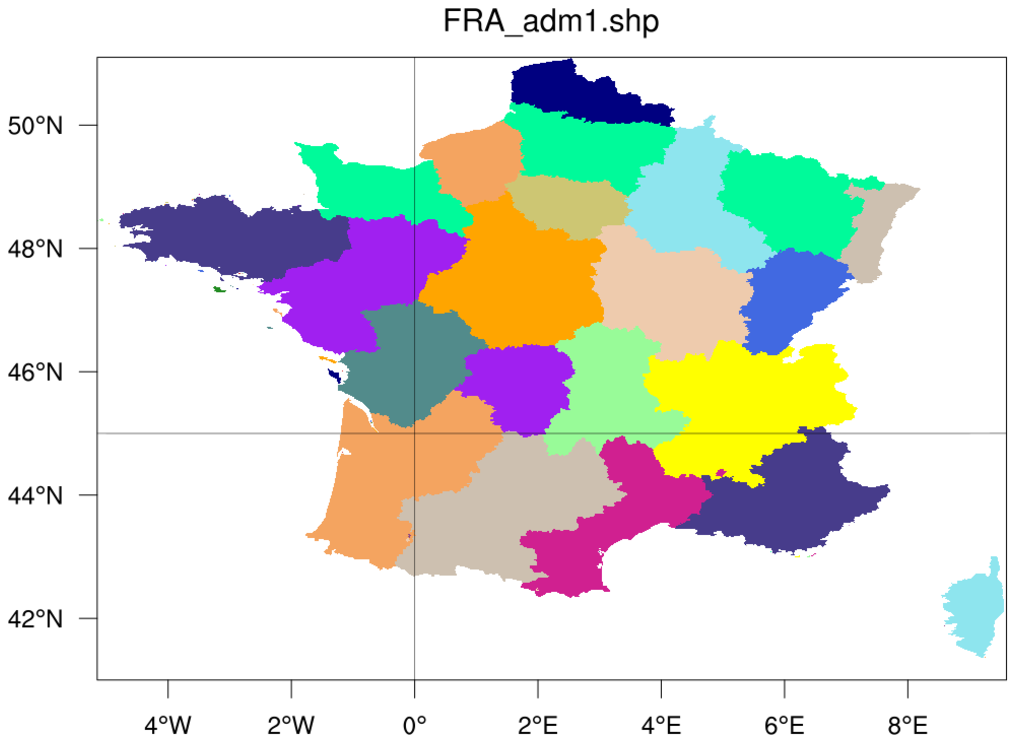
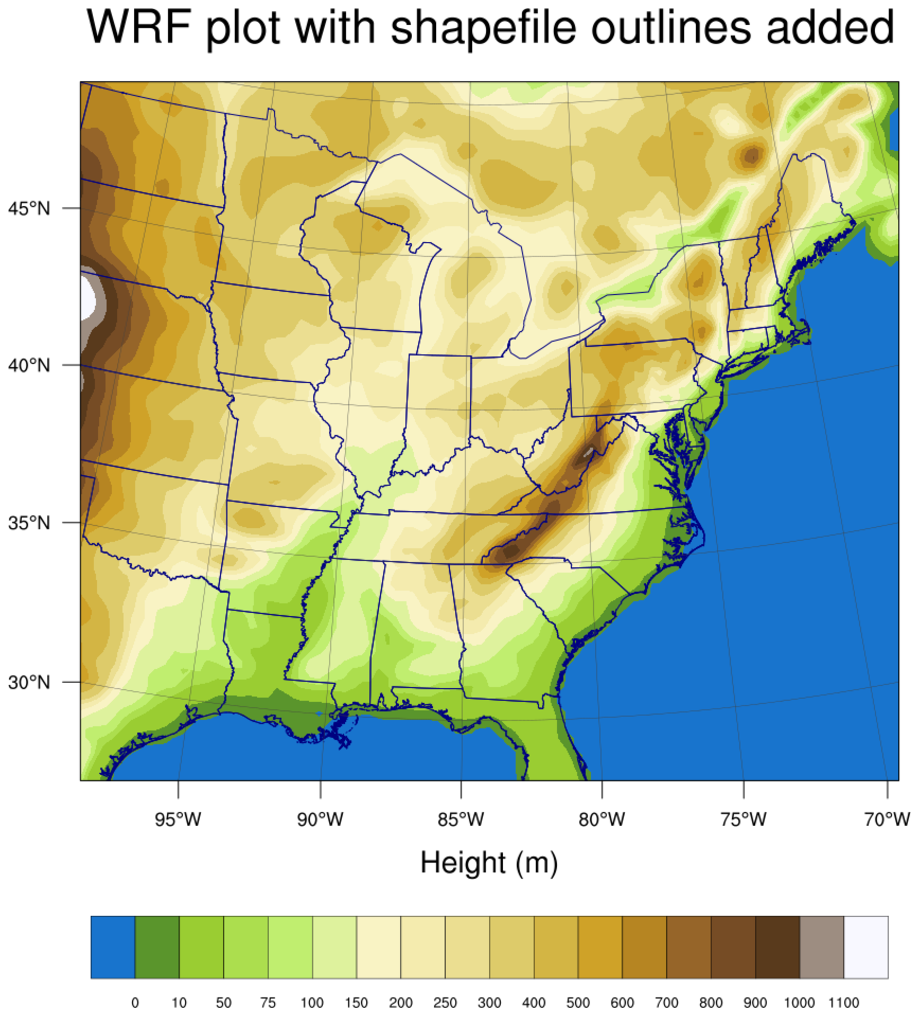
Shapefiles
shapefile1.py
shapefile2.py
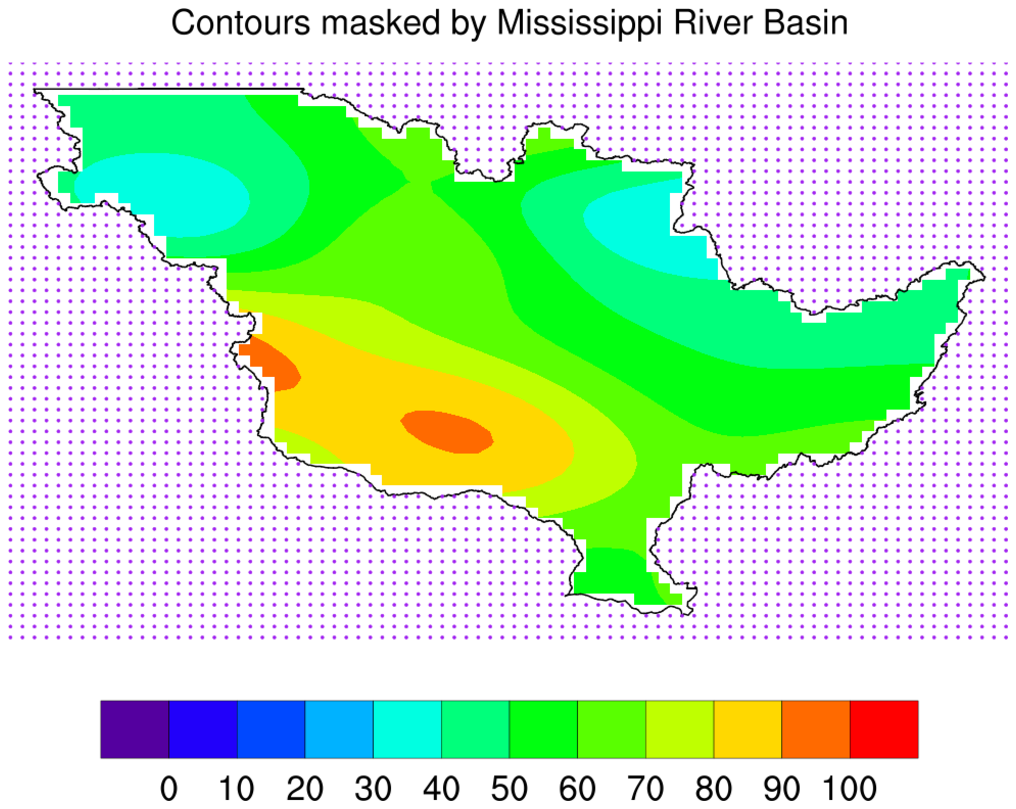
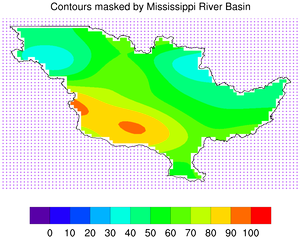
shapefile3.py


shapefile4.py

Meteograms
meteogram.py
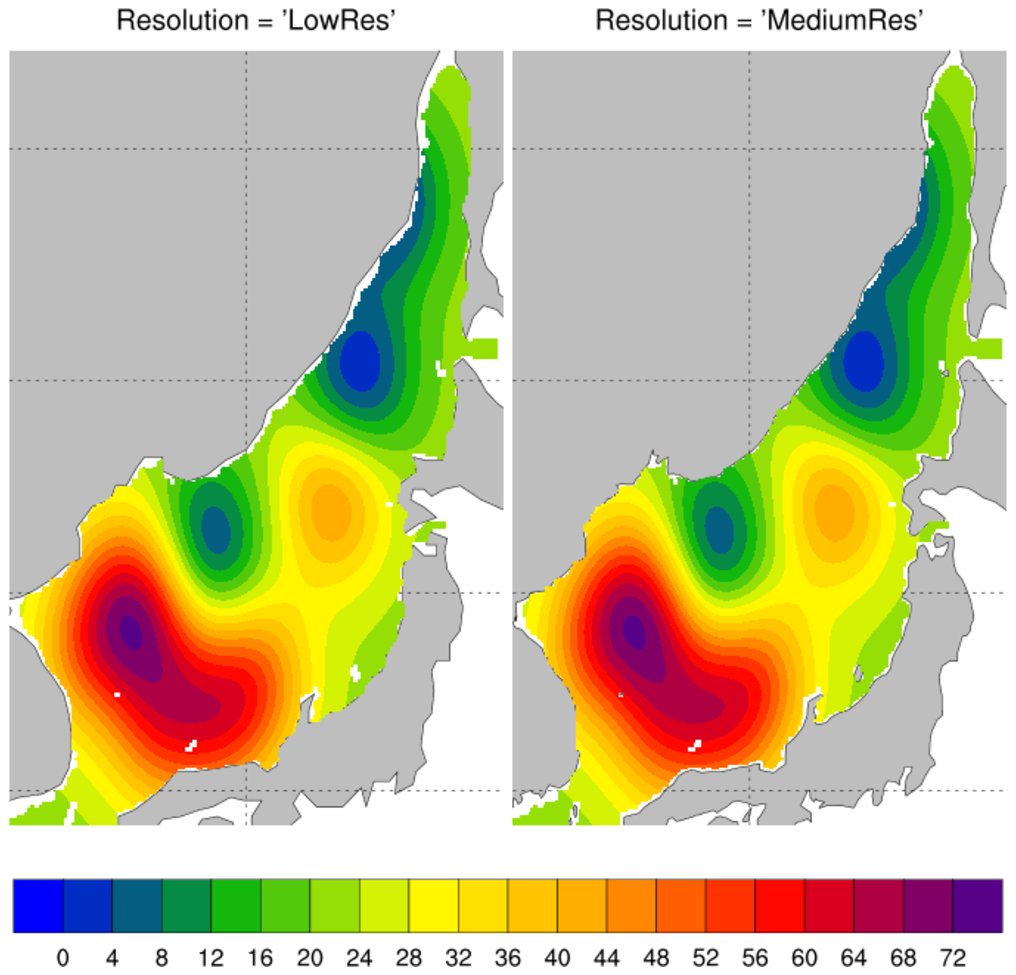
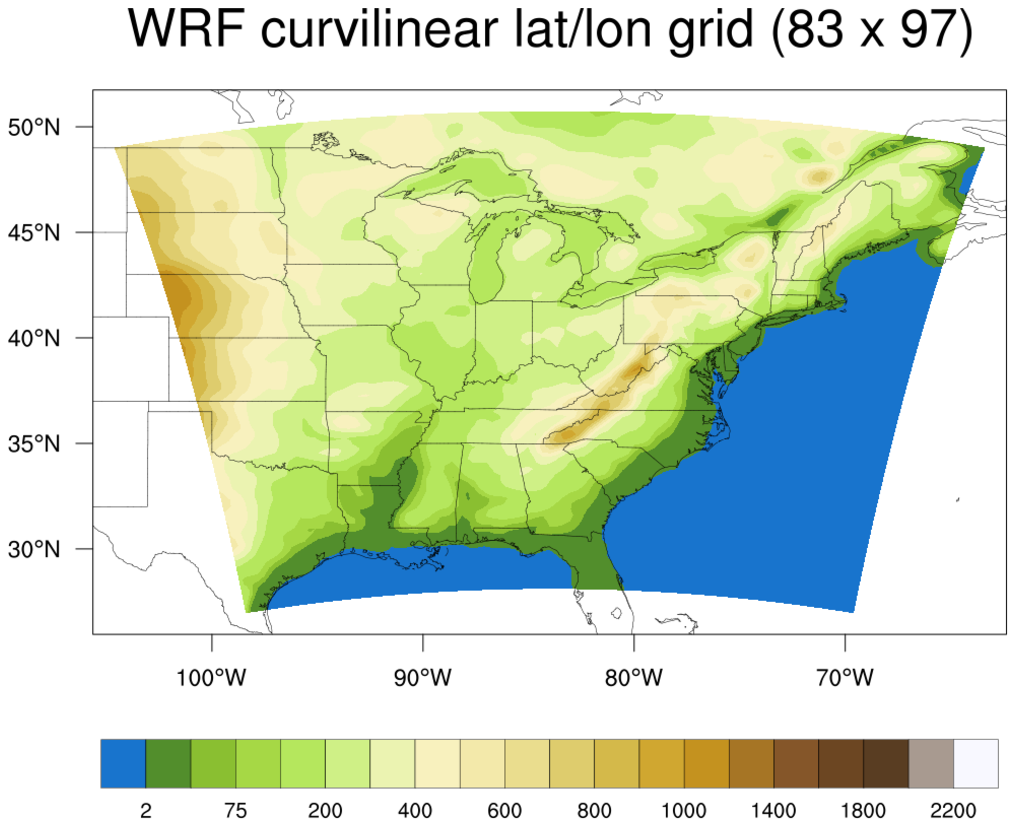
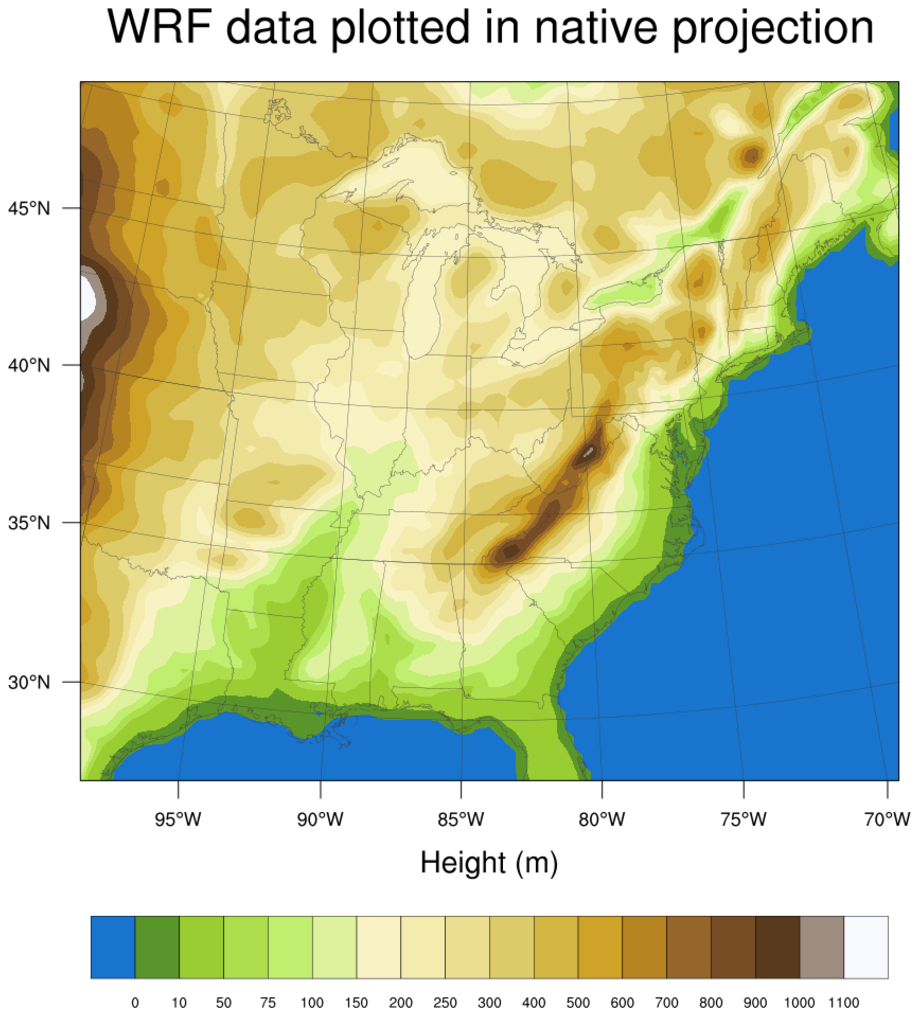
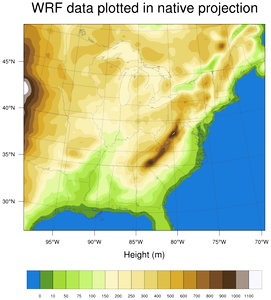
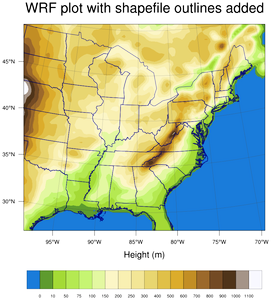
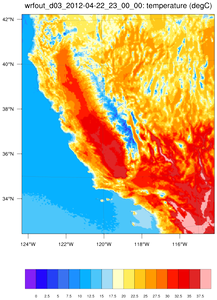
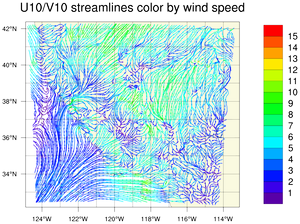
WRF
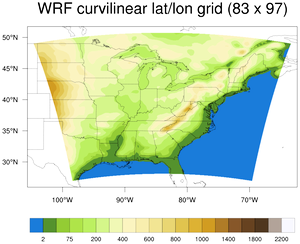
wrf1.py
wrf2.py
wrf3.py
wrf4.py
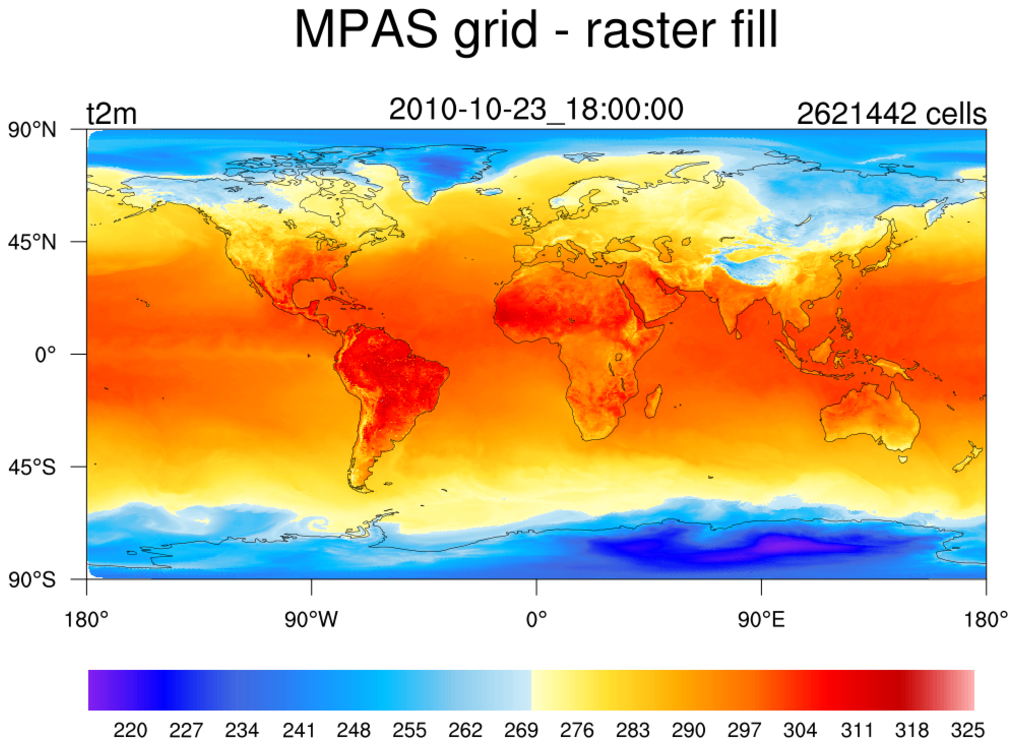
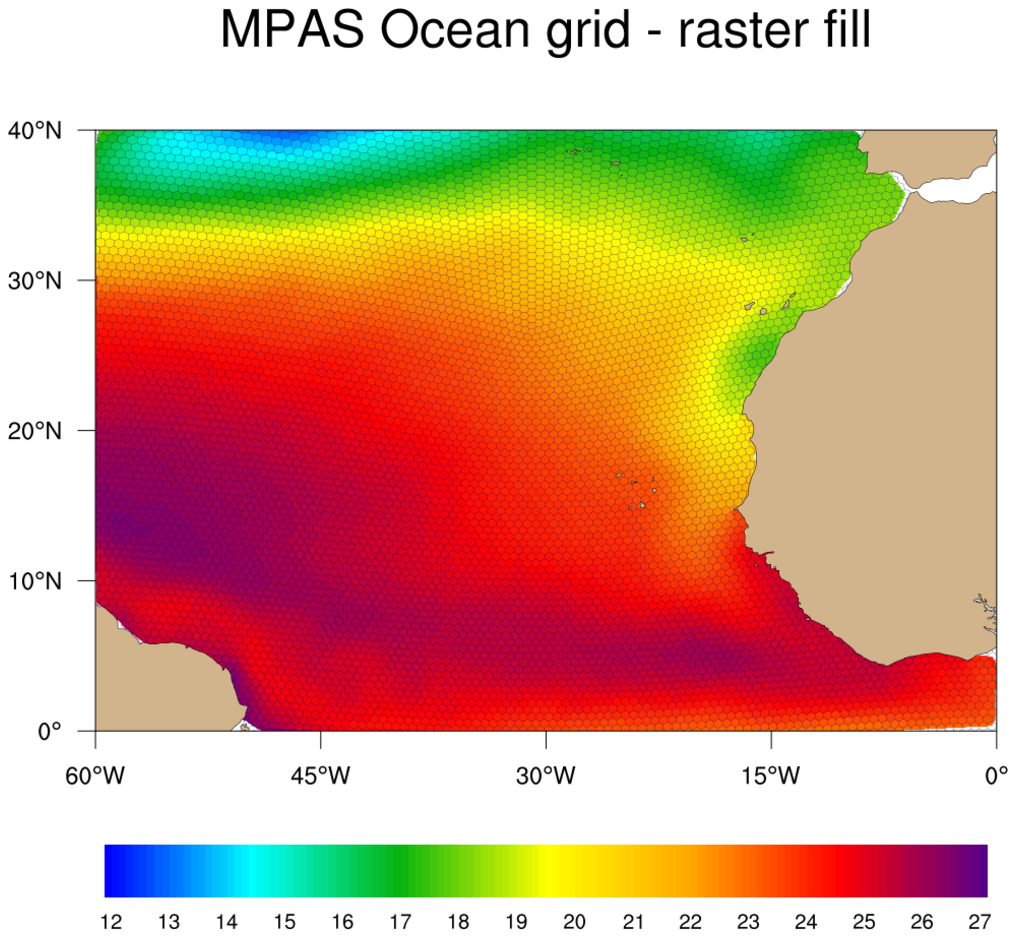
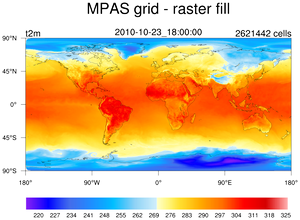
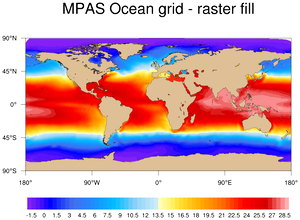
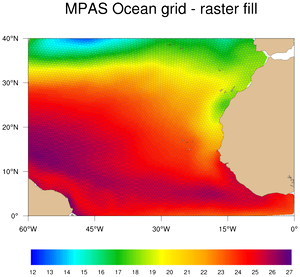
MPAS
mpas1.py
mpas2.py
mpas3.py
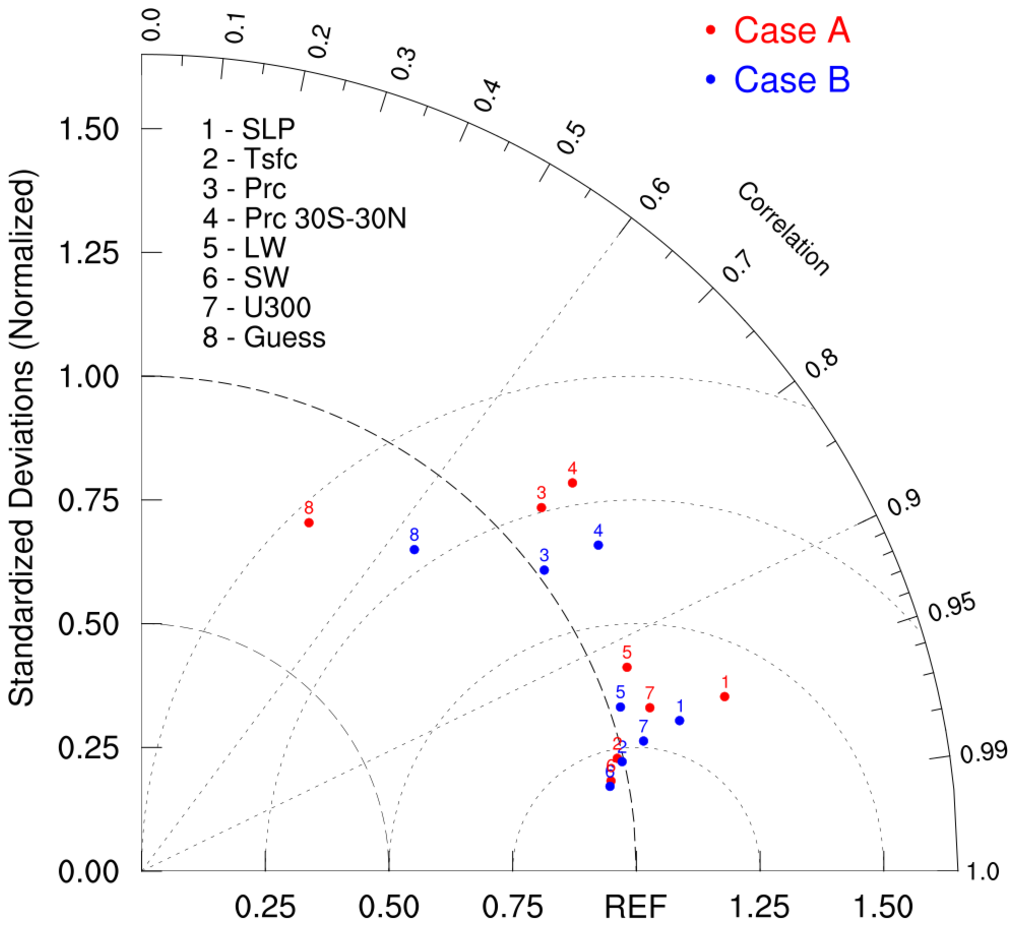
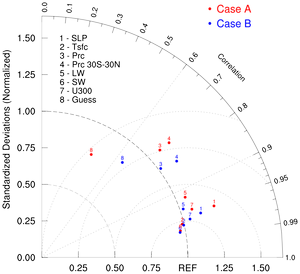
Taylor diagrams
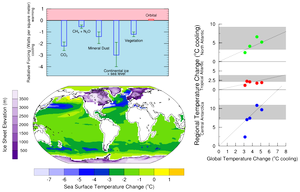
taylor_diagram1.py
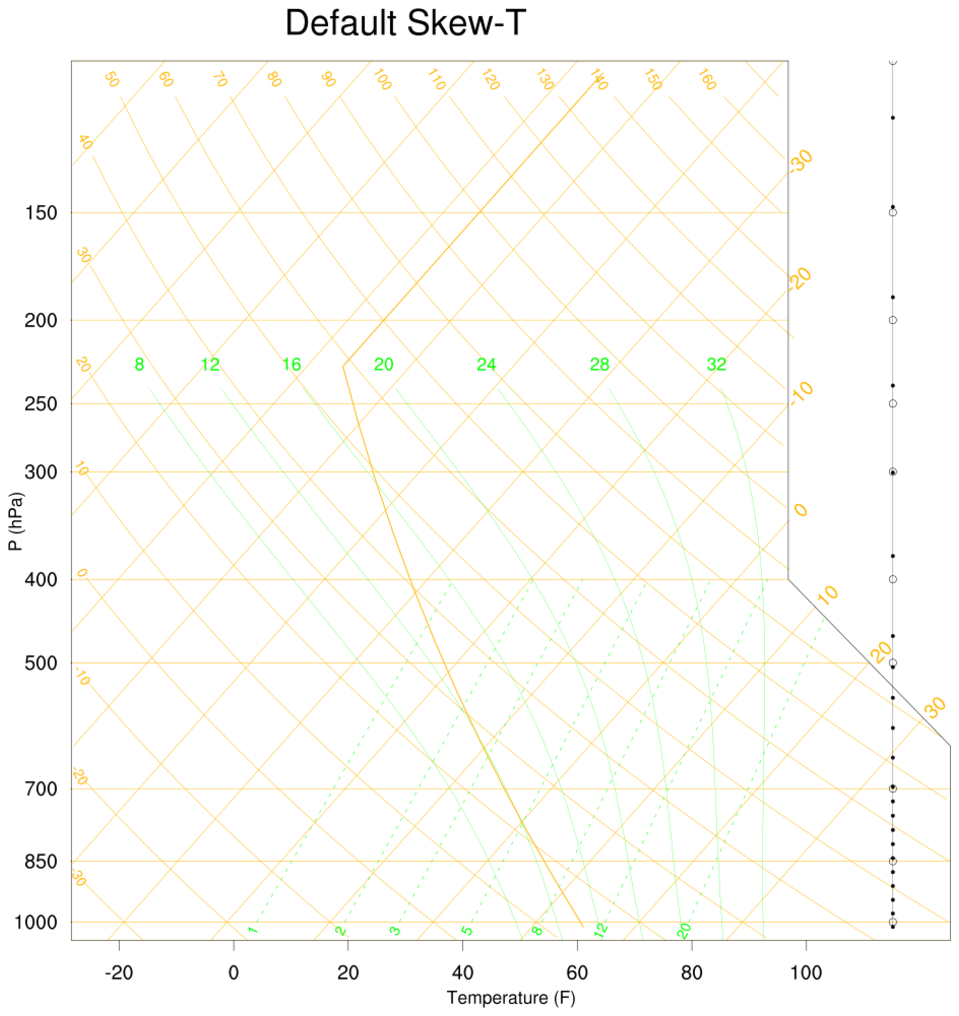
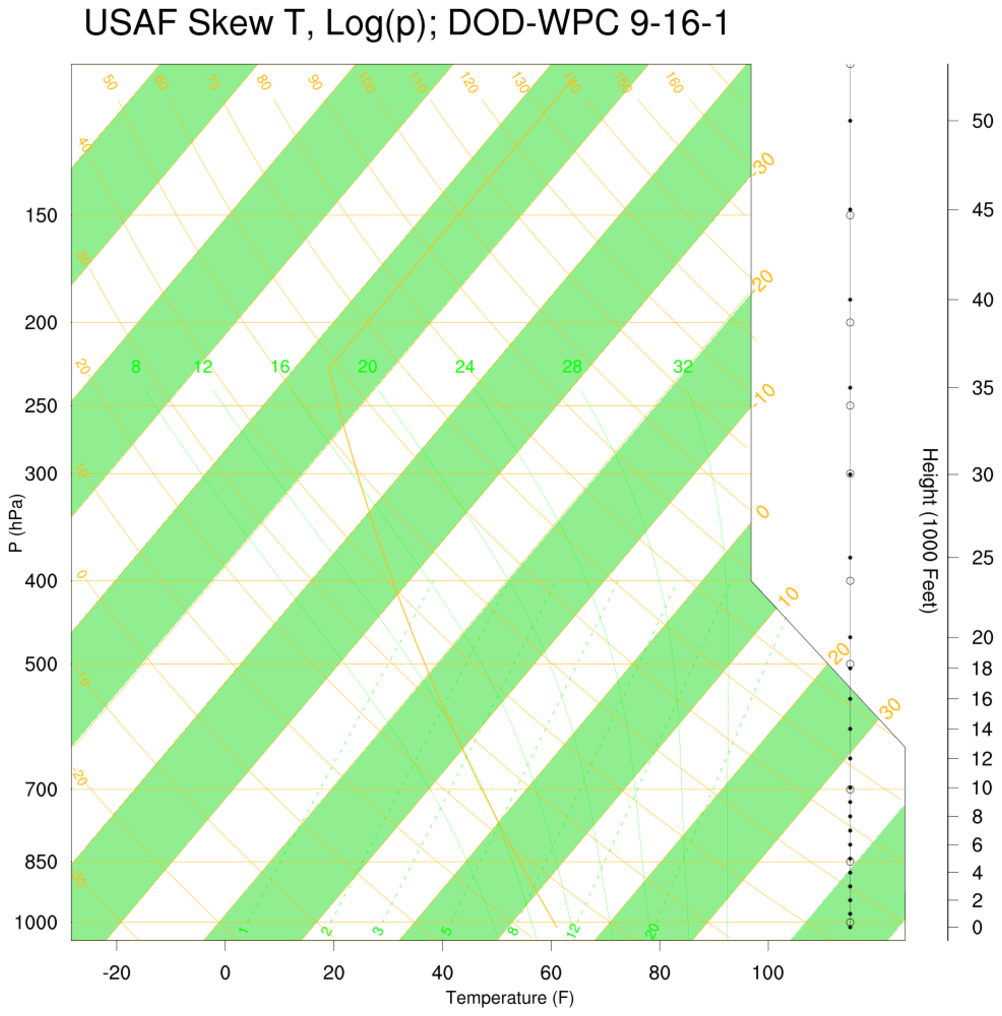
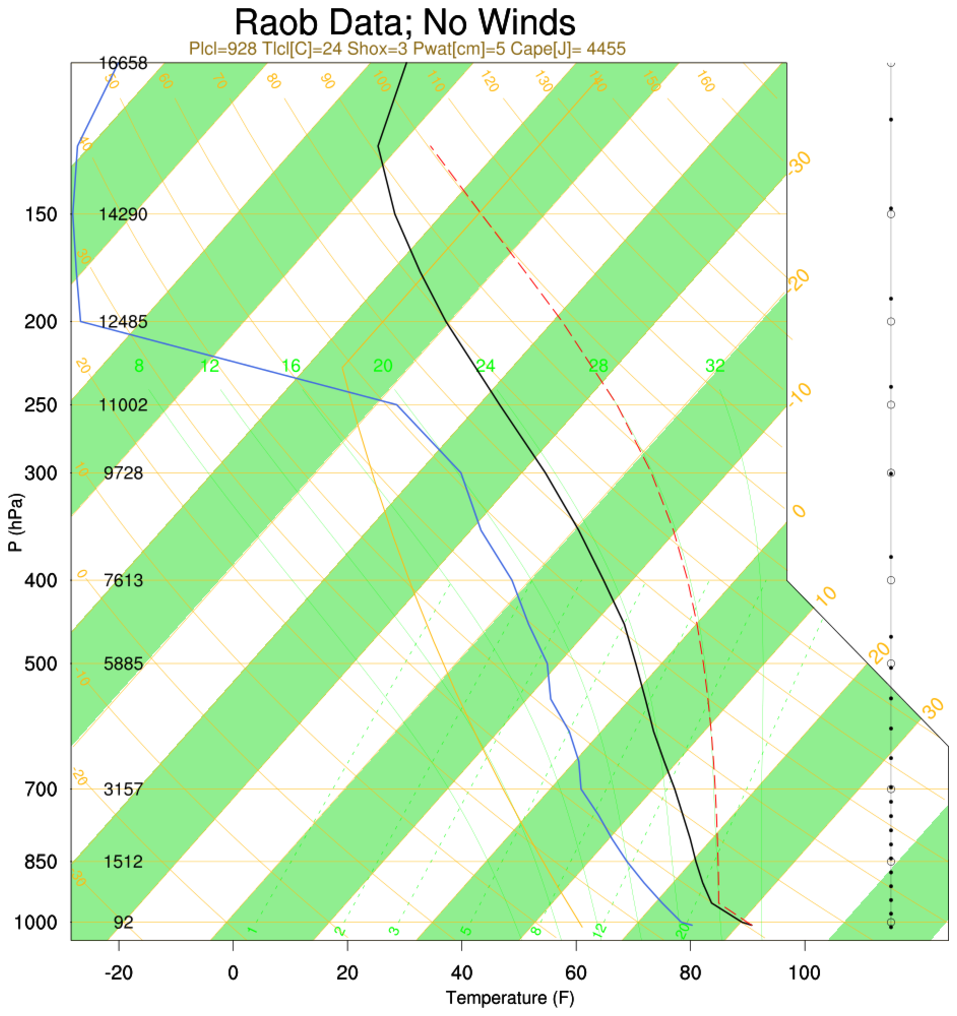
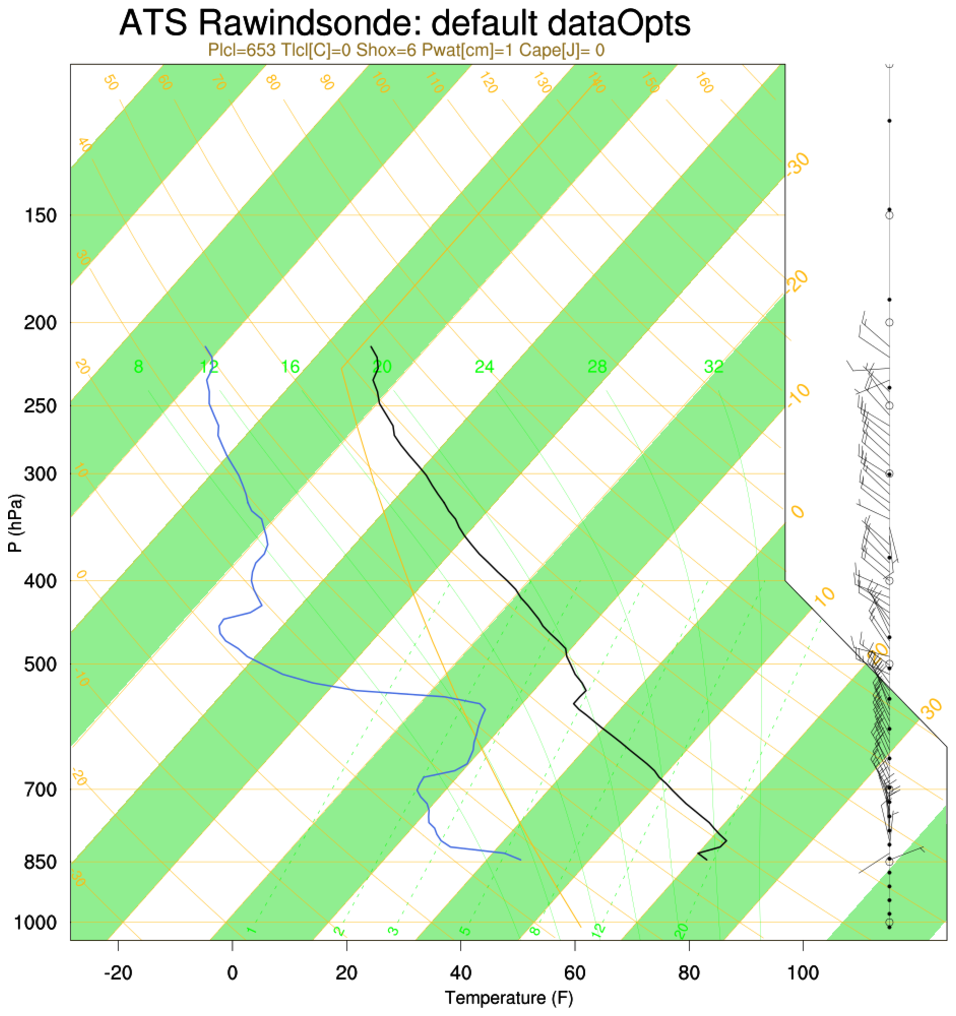
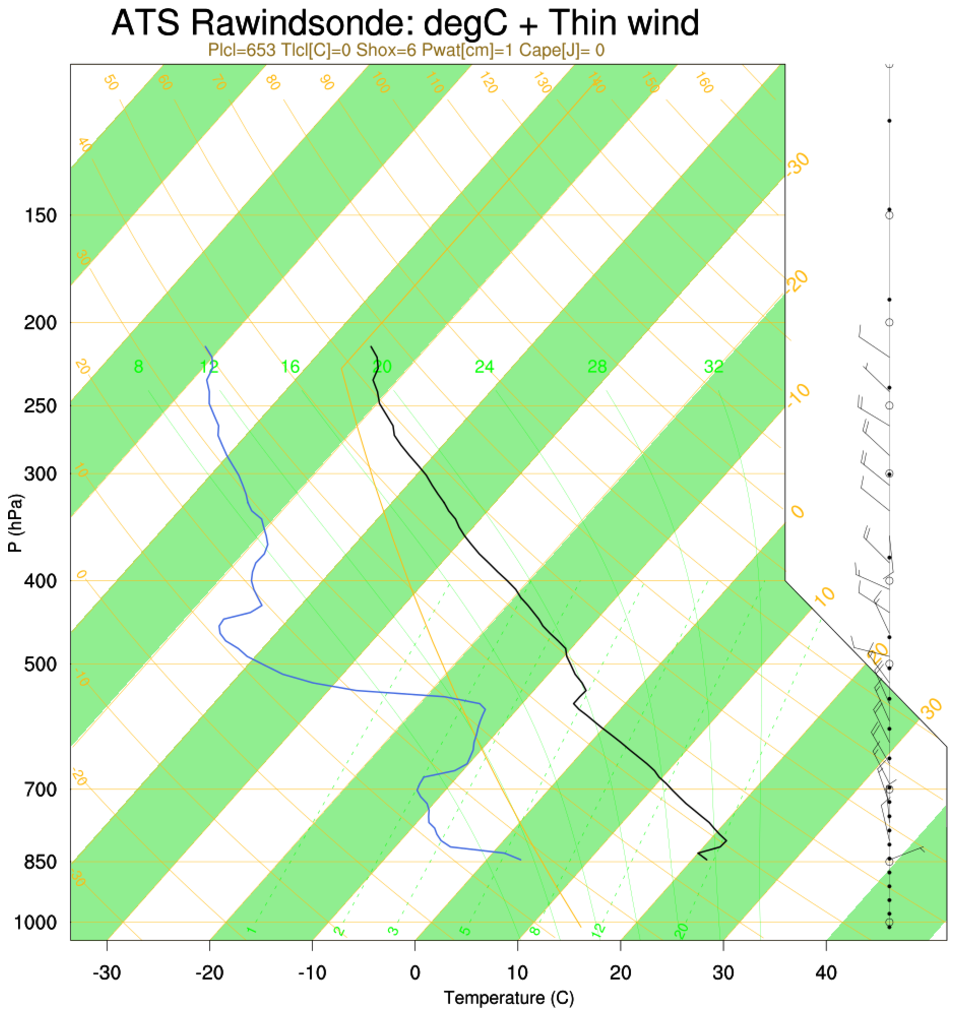
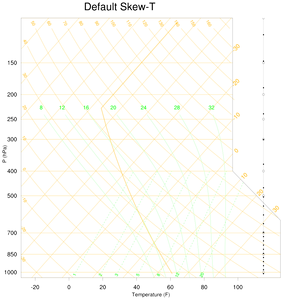
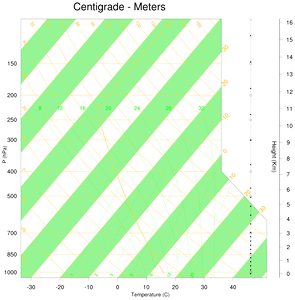
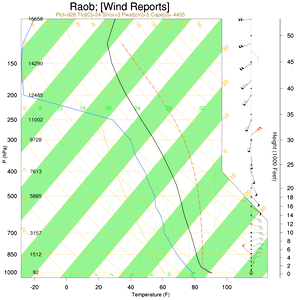
Skew-T plots
skewt1.py
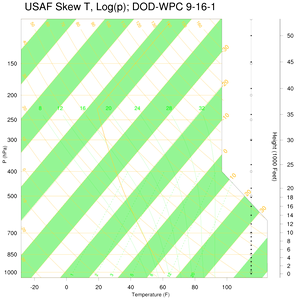
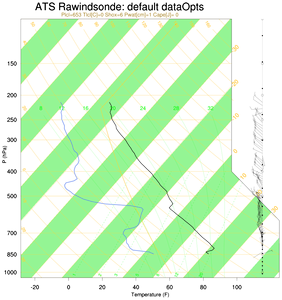
skewt2.py
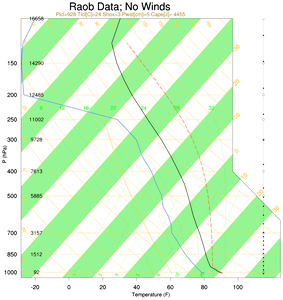
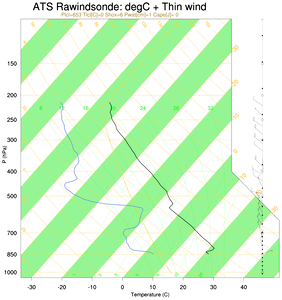
skewt3.py
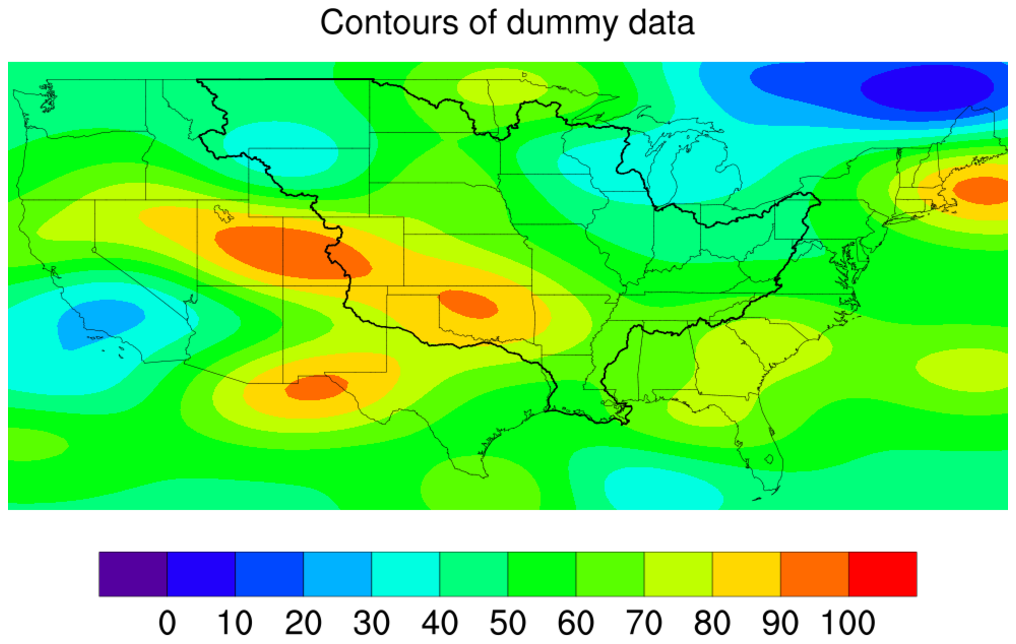
Masking
mask1.py
mask2.py

conmasklc.py
shapefile3.py
cn12p.py
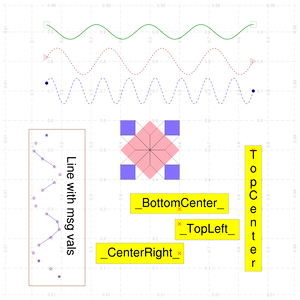
Polylines / polymarkers / polygons
map2.py
map3.py
mpas3.py
ndc_grid.py
ngl07p.py
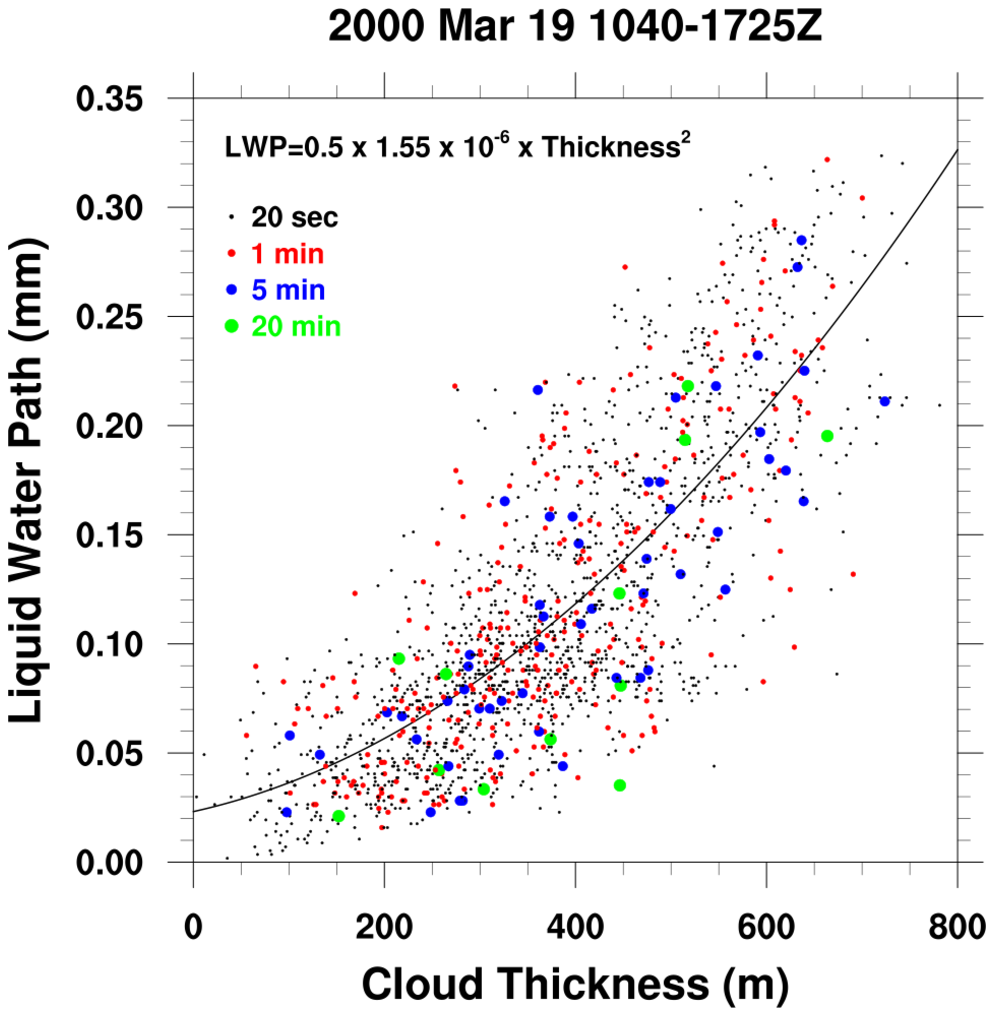
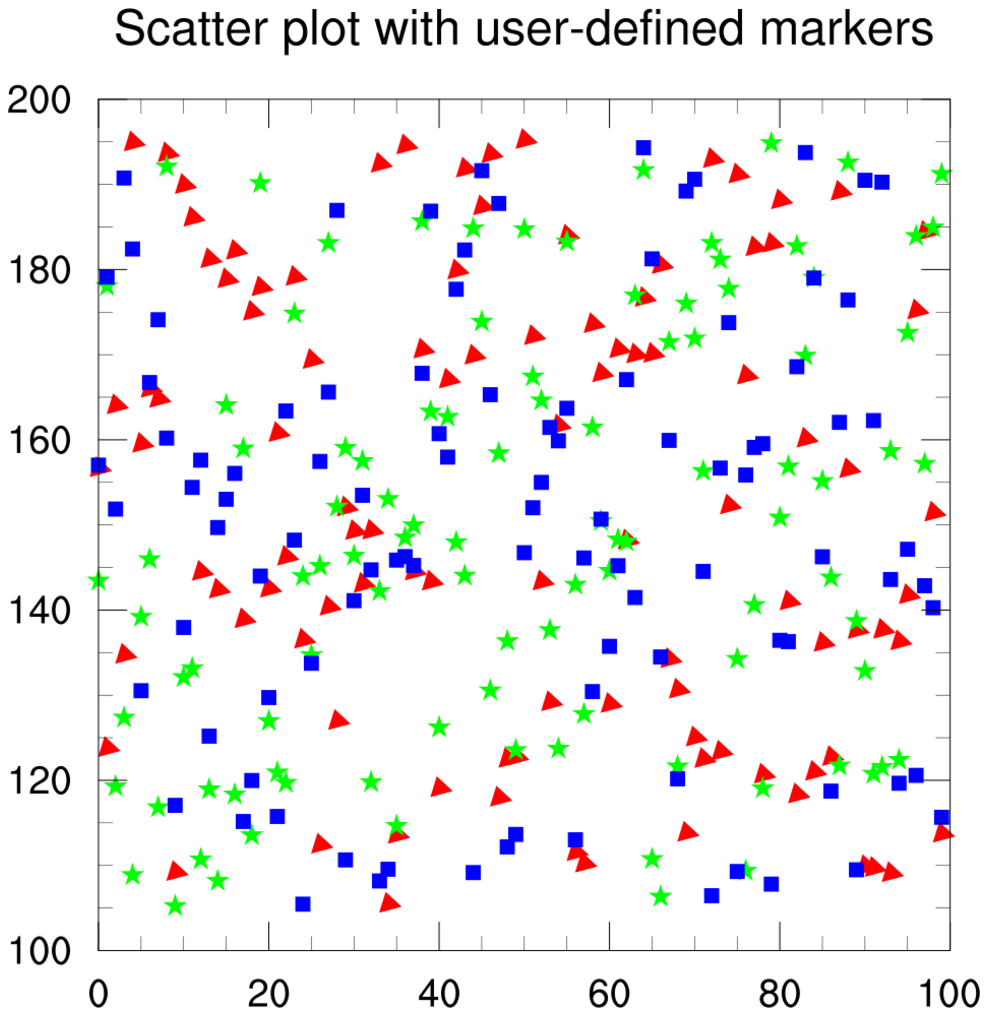
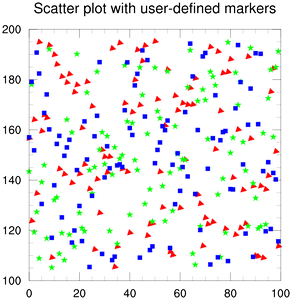
scatter1.py
scatter2.py
traj1.py
xy2.py
bar1.py
bar2.py
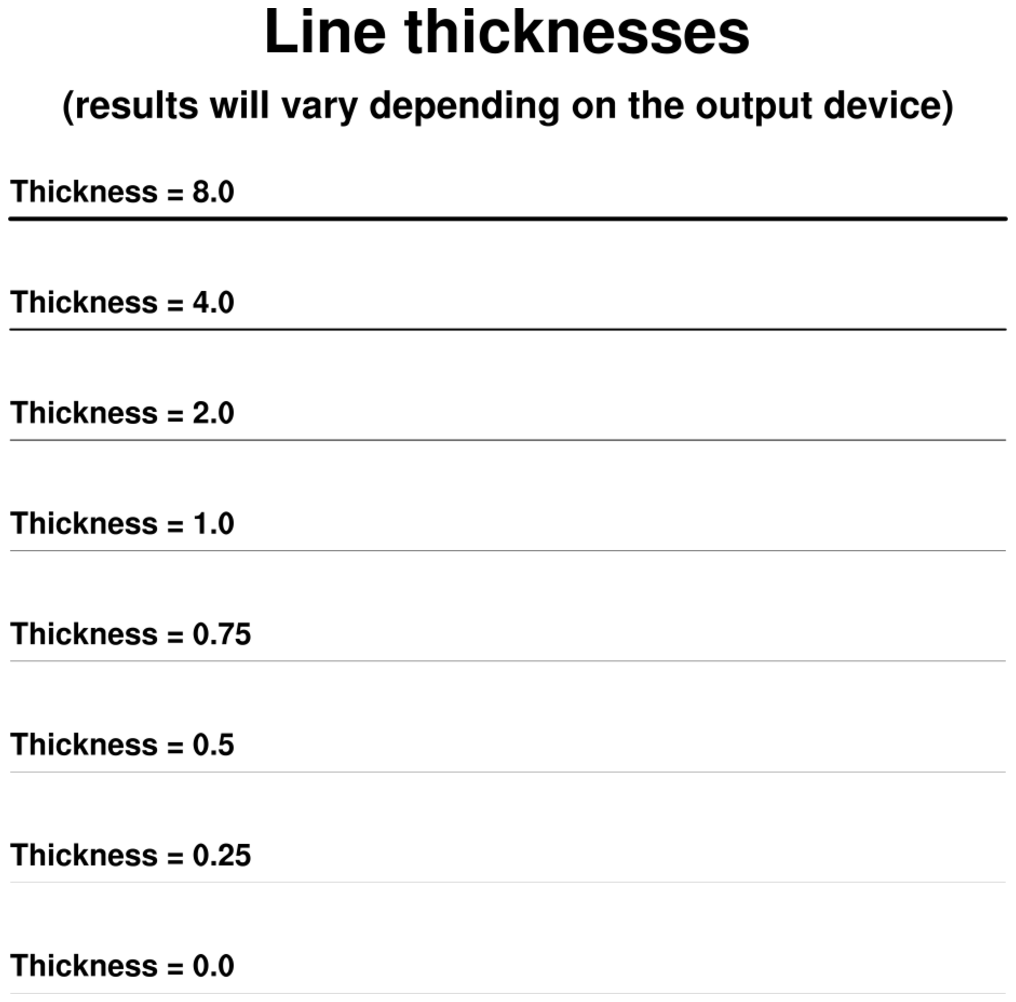
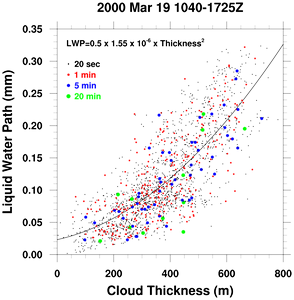
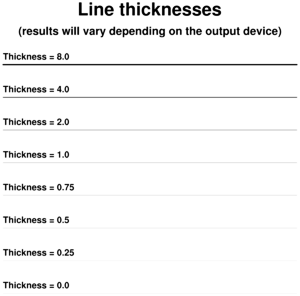
thickness.py
viewport1.py
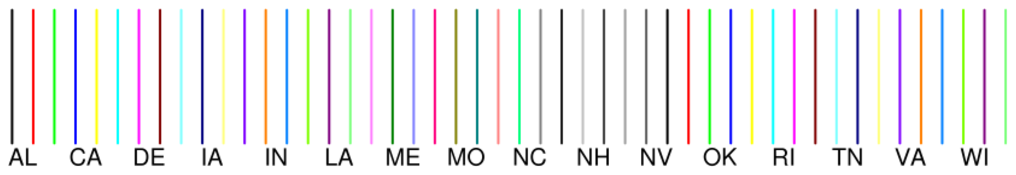
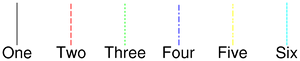
Label bars
labelbar.py

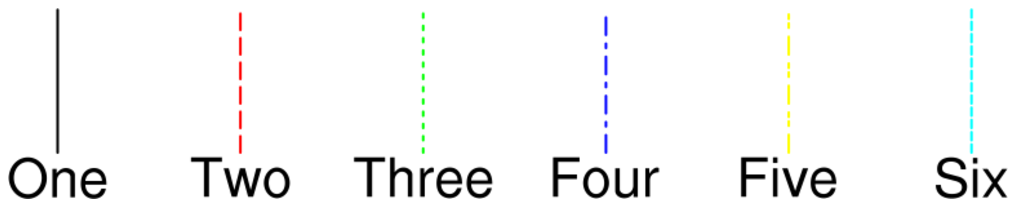
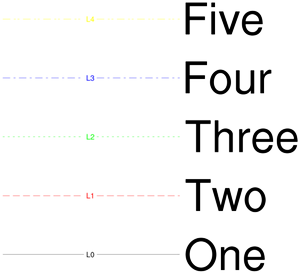
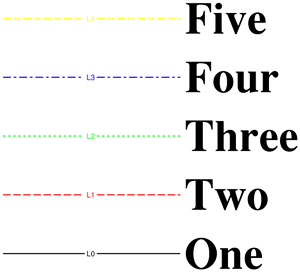
Legends
legend.py
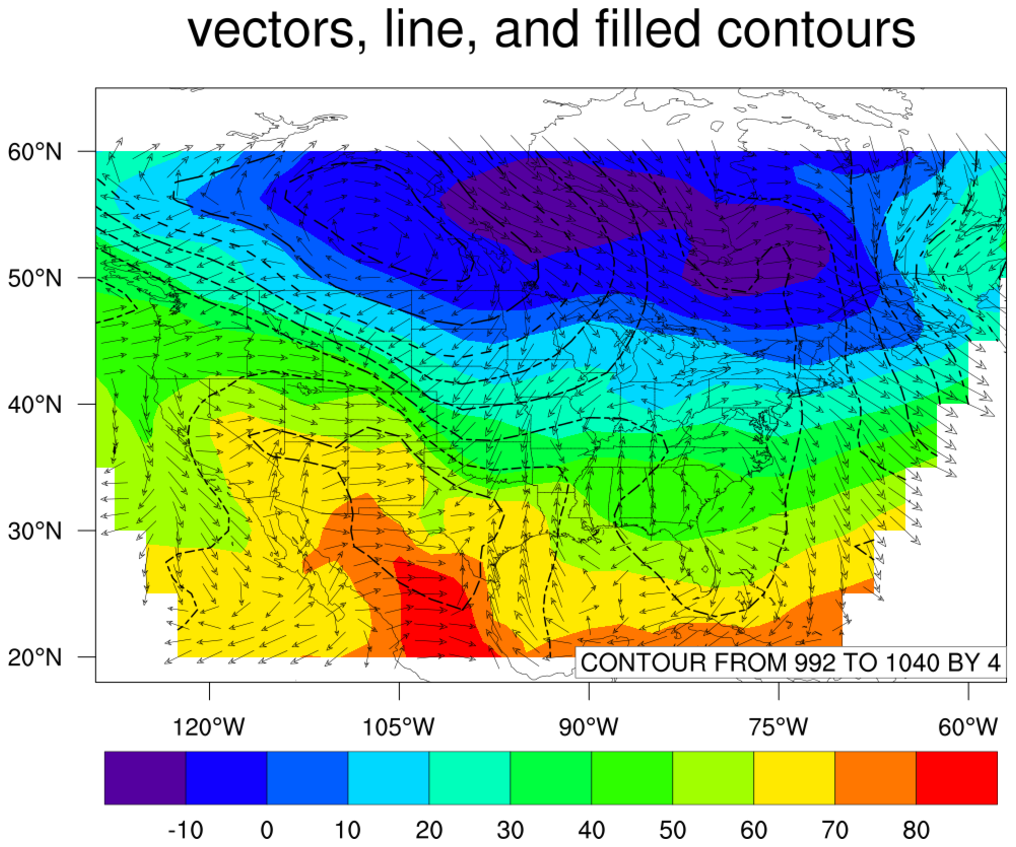
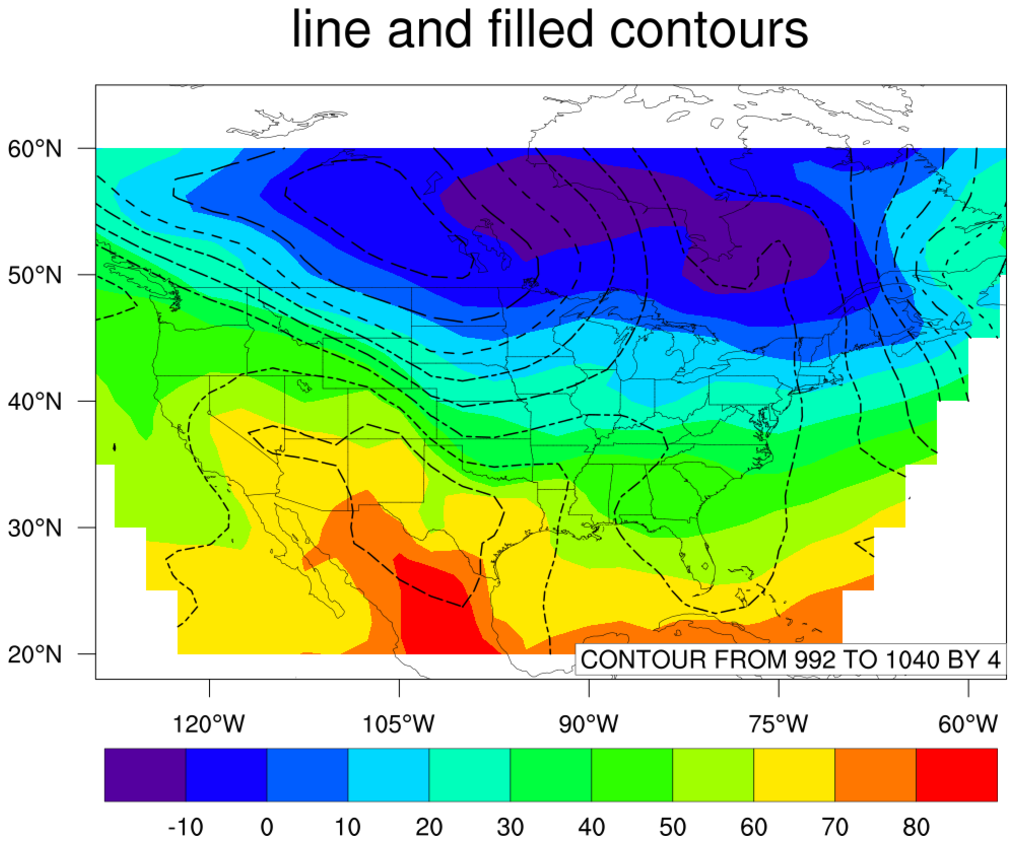
Overlays
overlay1.py


cn12p.py
newcolor3.py
newcolor6.py
spaghetti.py
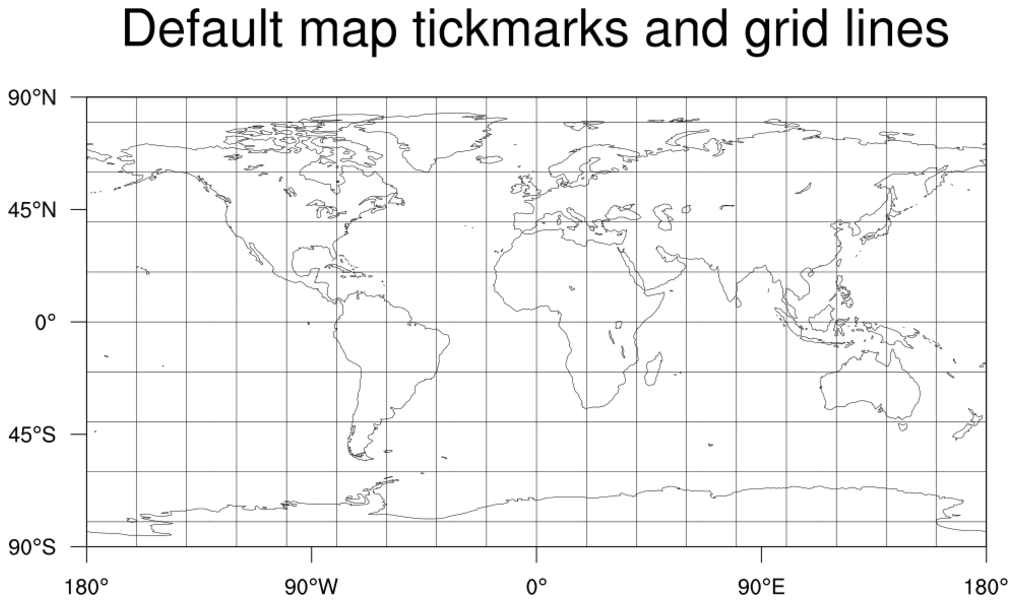
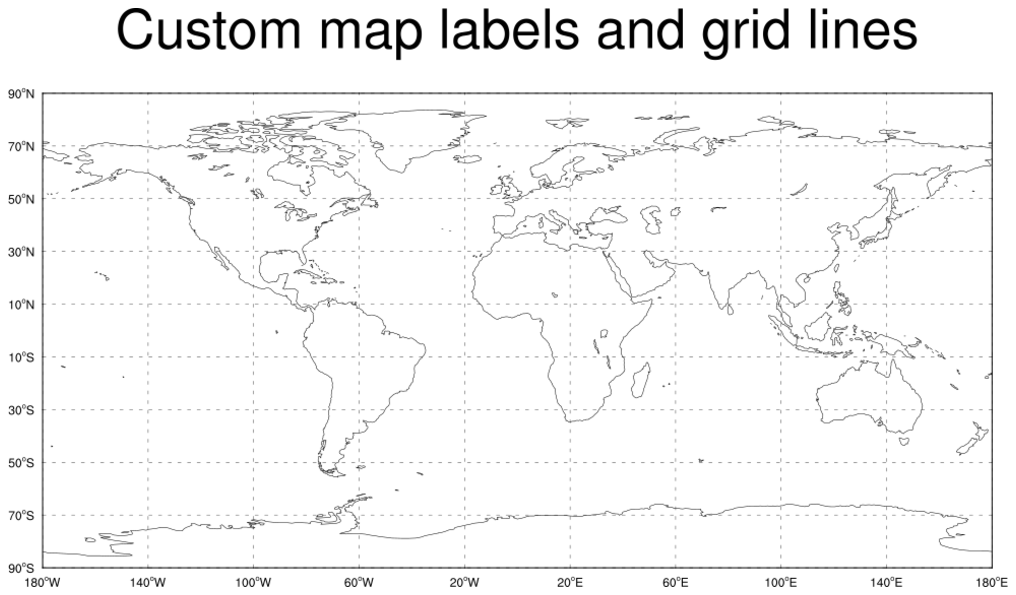
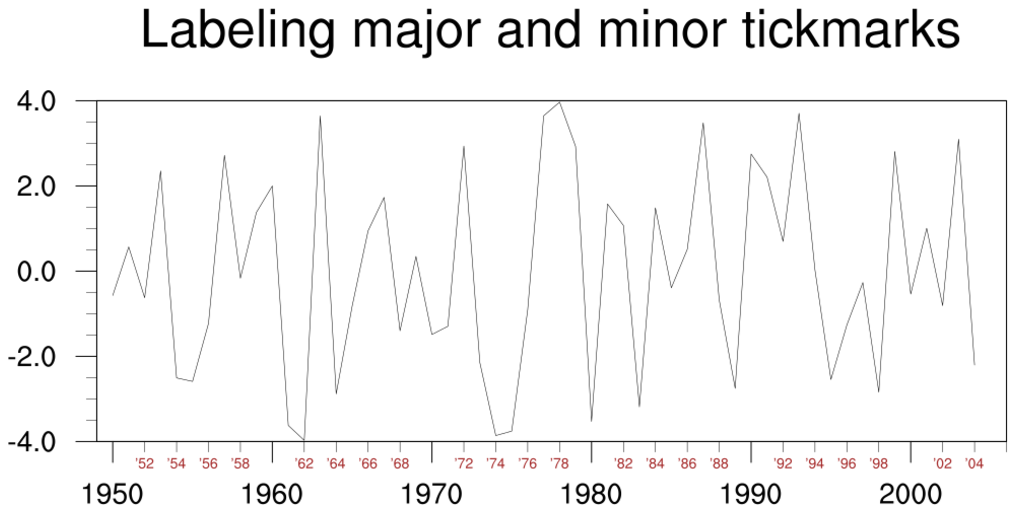
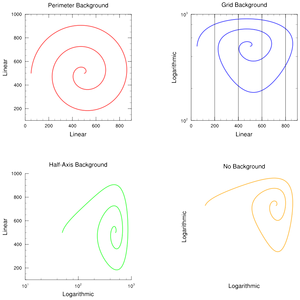
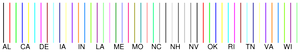
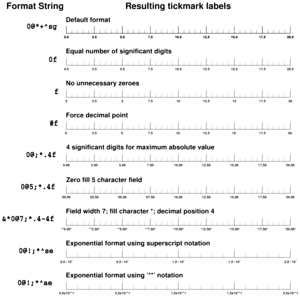
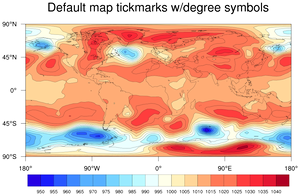
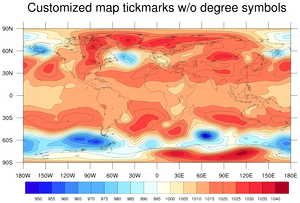
Tickmarks
format.py
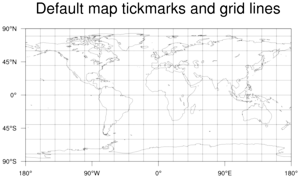
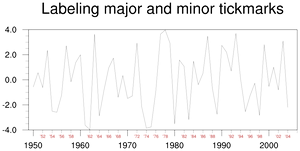
tickmark1.py
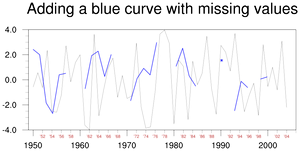
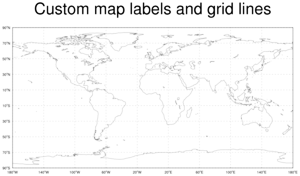
tickmark2.py
map3.py
Computational / non-graphical examples
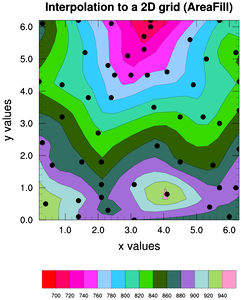
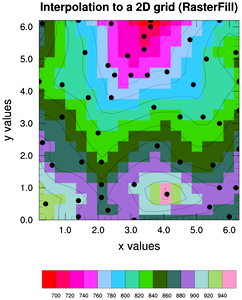
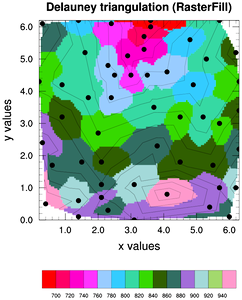
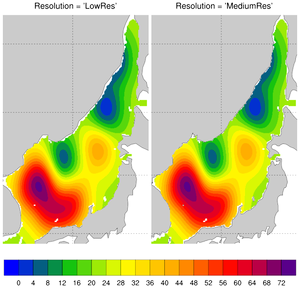
natgrid1.py
gaus.py
This example does not produce any graphics.
vinth2p.py
This example does not produce any graphics.
nio01.py
This example does not produce any graphics.
nio02.py
This example does not produce any graphics.
nio03.py
This example does not produce any graphics.
nio04.py
This example does not produce any graphics.
datatondc1.py
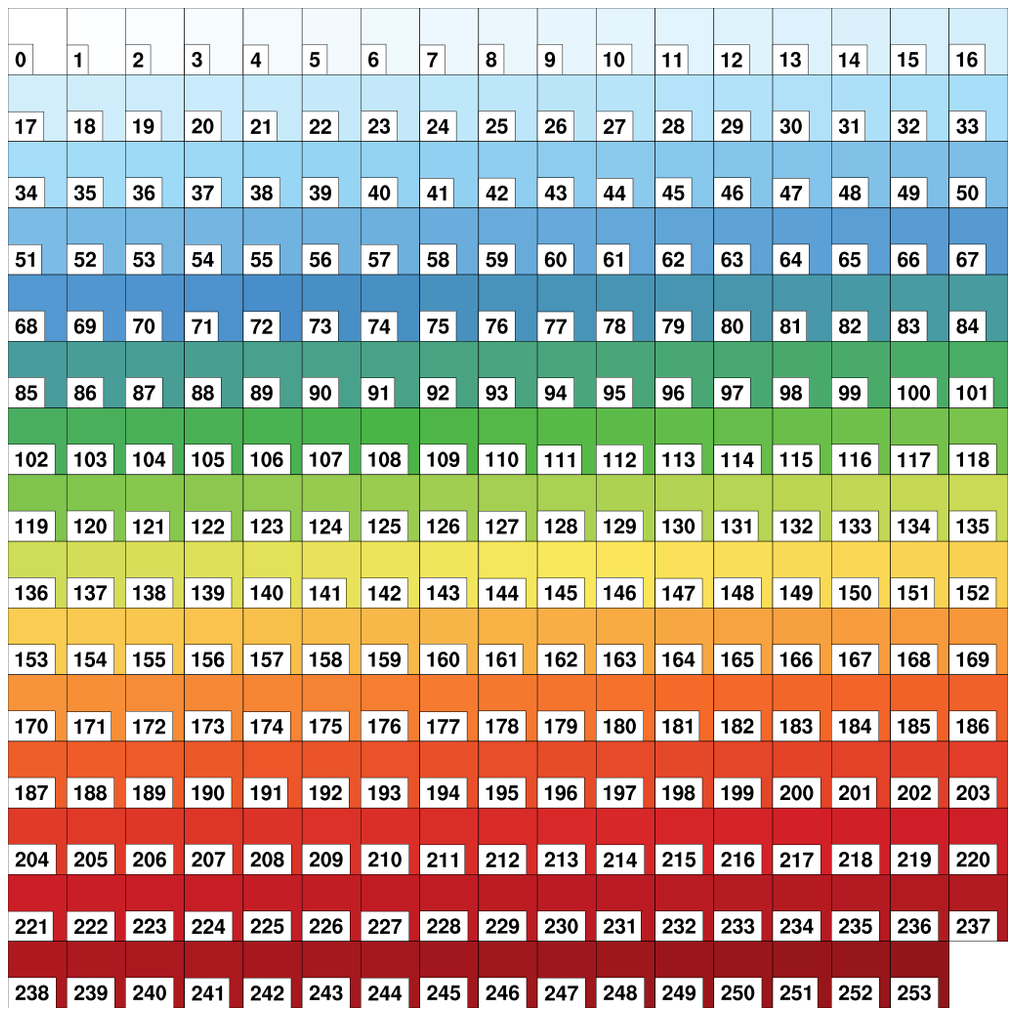
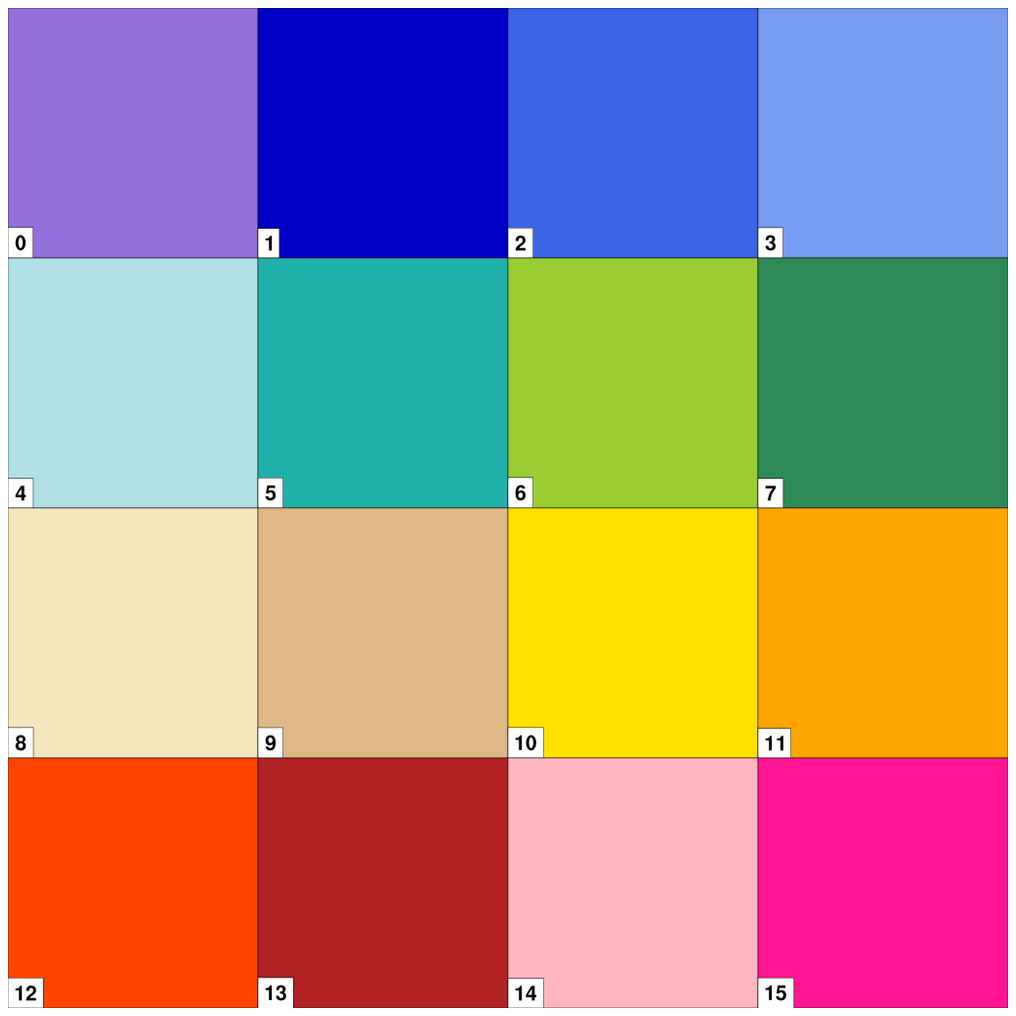
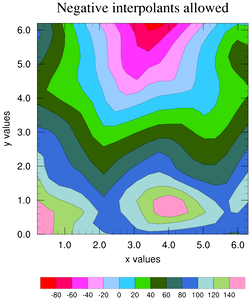
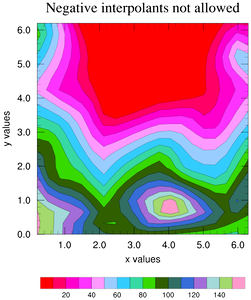
Colors
color1.py
color2.py
color3.py
color4.py
color5.py
color6.py
color7.py
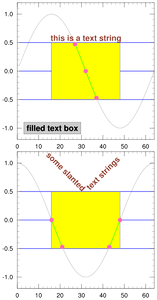
Annotations
multi_y.py
streamline3.py
viewport1.py
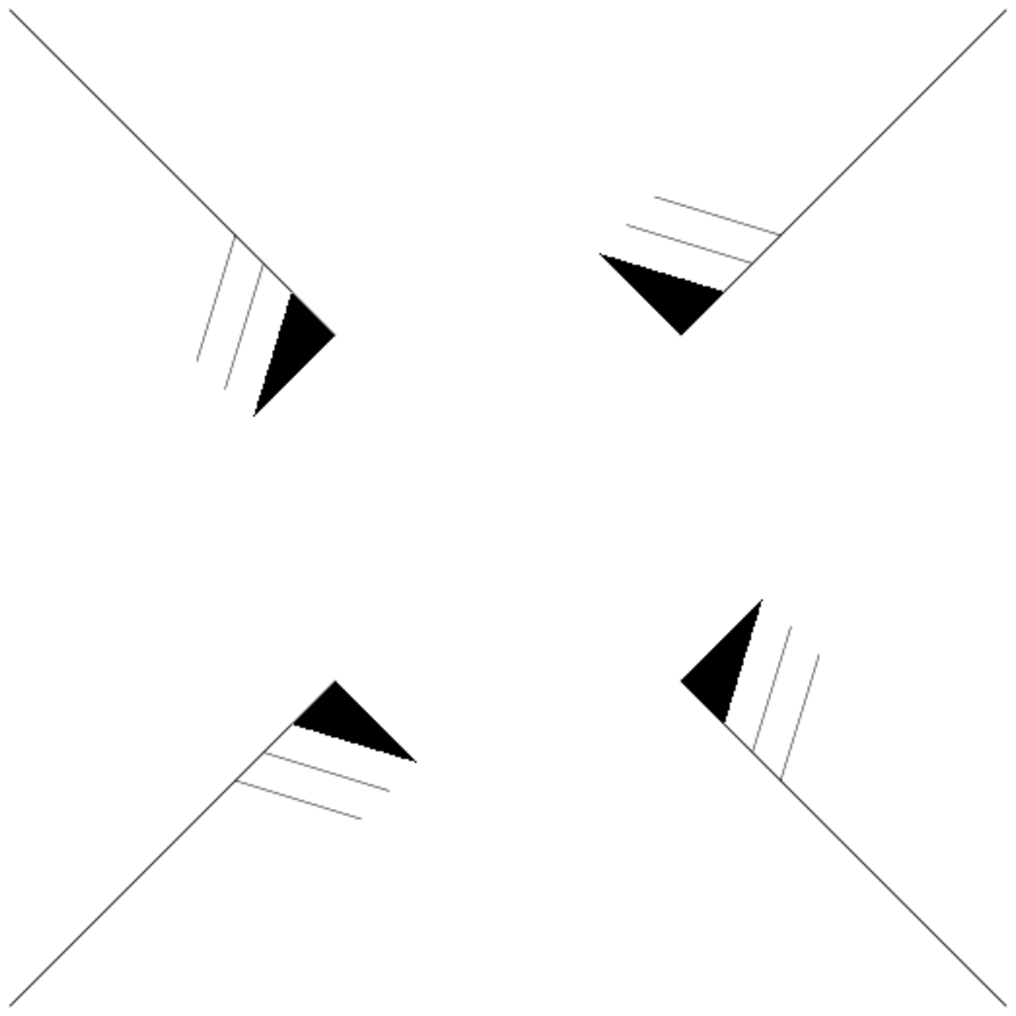
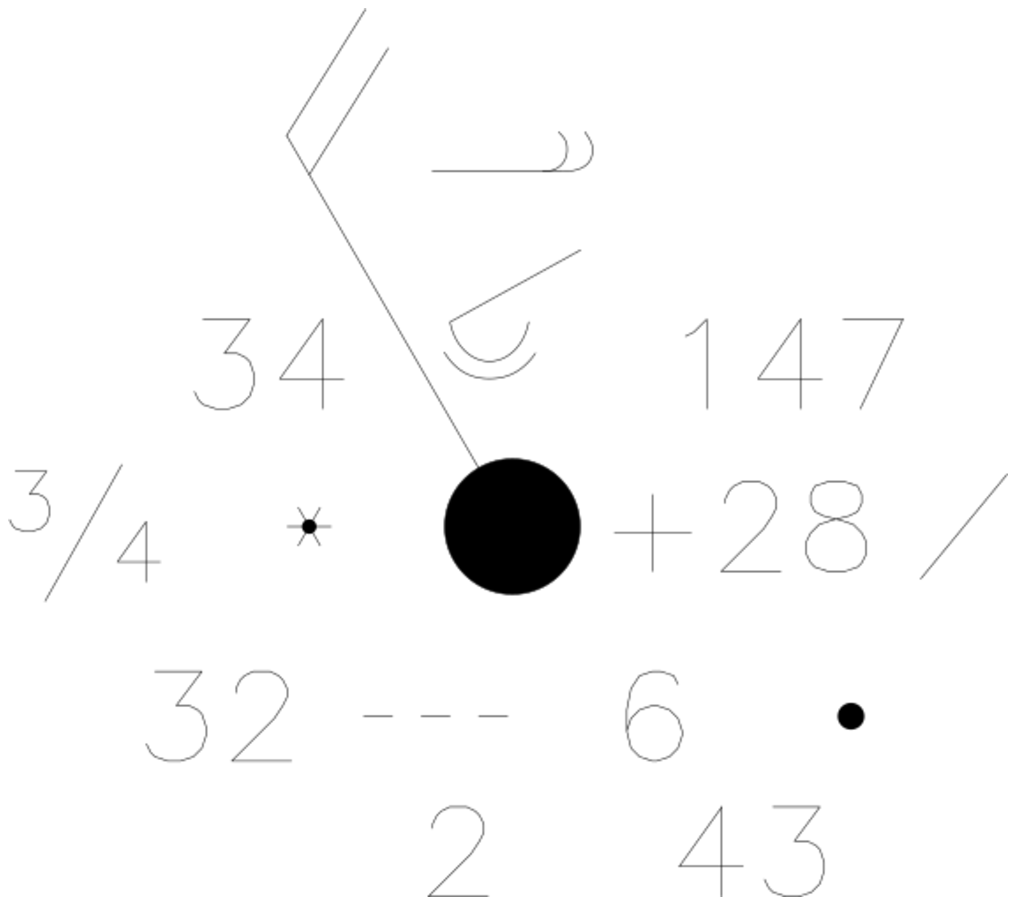
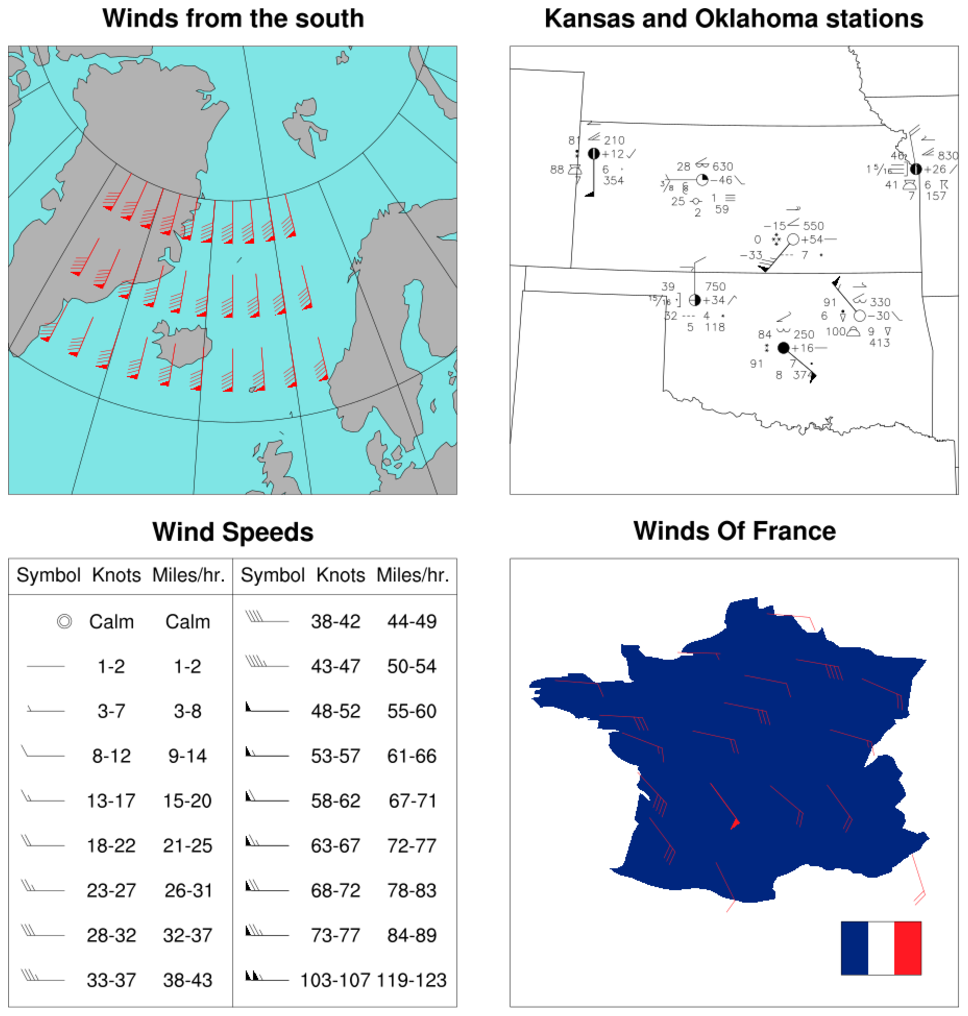
Wind barbs
wmbarb.py
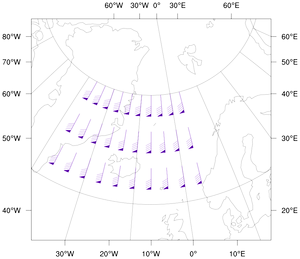
wmbarbmap.py

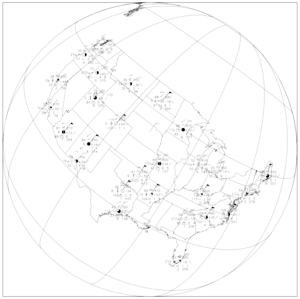
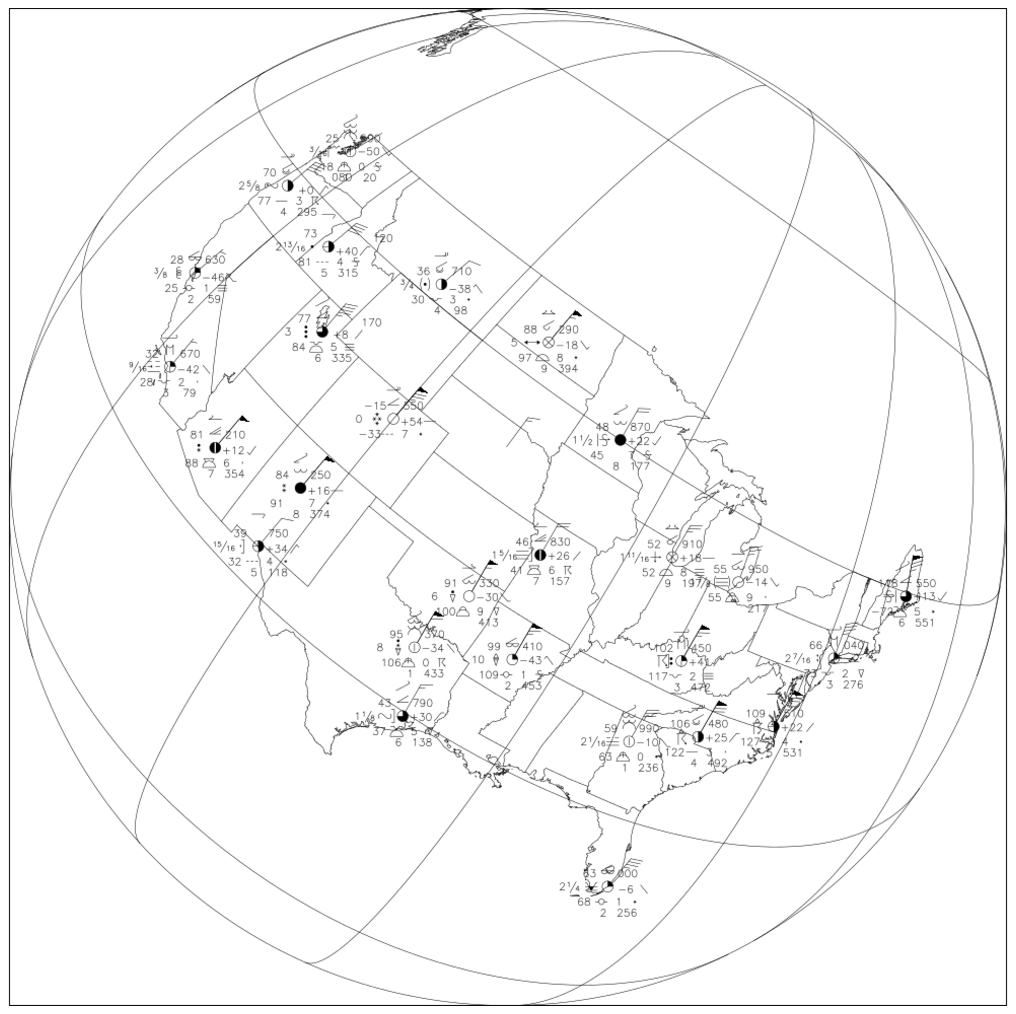
wmstnm01.py
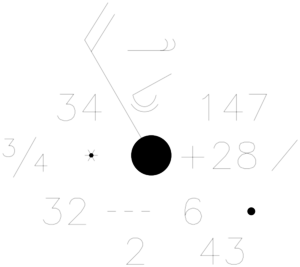
wmstnm02.py
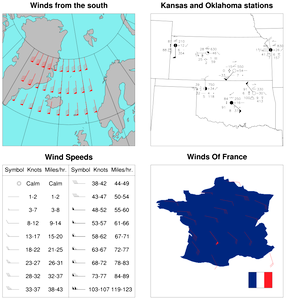
wmstnm03.py