
Ngl.contour
Creates and draws a contour plot.
Prototype
plot = Ngl.contour(wks, data, res=None)
Arguments
wksThe identifier returned from calling Ngl.open_wks.
dataThe data to contour. data can be a two-dimensional NumPy array or NumPy masked array (ny x nx), or a one-dimensional array that is accompanied by one-dimensional coordinate arrays of the same length (see description below).
res=NoneAn (optional) instance of the Resources class having PyNGL resources as attributes.
Return value
plotA PlotId of the contour plot created is returned.
Description
This function creates and draws a contour plot on the given workstation and advances the frame. Plot options (resources) can be set via the res variable.
If data is two-dimensional (ny x nx) and coordinate values for the X and Y axes are not available, then index values will be used on the axes.
If data is two-dimensional and axes coordinate information is available, then set the sfXArray resource to the one-dimensional NumPy array (of length nx) that represents the X axis, and sfYArray to the one-dimensional NumPy array (of length ny) that represents the Y axis. Or, you can optionally send some end point values via the resources sfXCStartV, sfXCEndV, sfYCStartV, sfYCEndV resources.
If data is one-dimensional, then sfXArray and sfYArray must be set and be the same length as data (see the examples below).
As of version 1.3.0, if data is a masked array, then any values equal to the fill value will not be plotted. If data is not a masked array and it contains missing values, then set the resource sfMissingValueV to the missing value.
Note that PyNGL internally sets some contour and labelbar resources for you, depending on how other resources are set. See the list of default settings for more information.
See Also
Ngl.contour_map, Ngl.nice_cntr_levels
Contour resources
LabelBar resources
ScalarField resources
Title resources
TickMark resources
Transformation resources
View resources
Transform resources
PlotManager resources
Special "ngl" resources
Examples
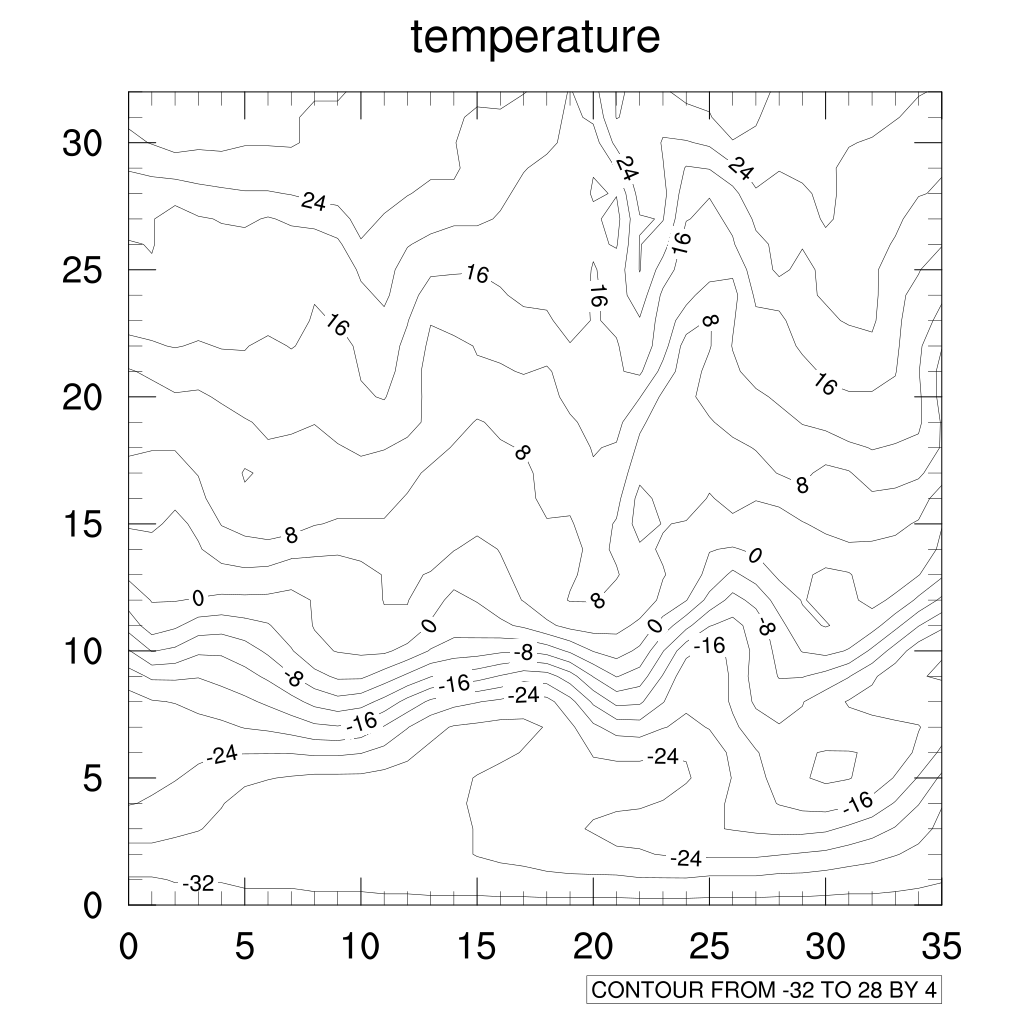
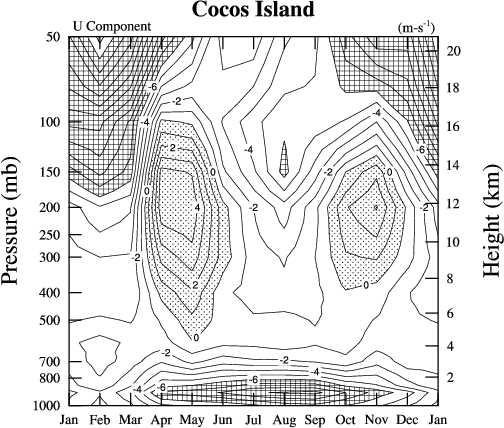
For examples on contouring two-dimensional data, see examples ngl02p.py (output), ngl08p.py (output), and ngl11p.py1 (output).
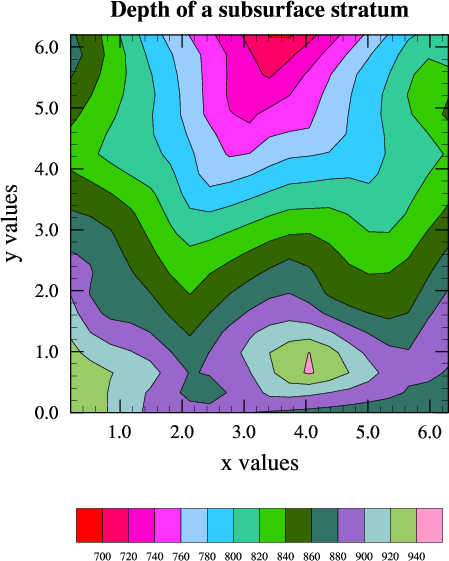
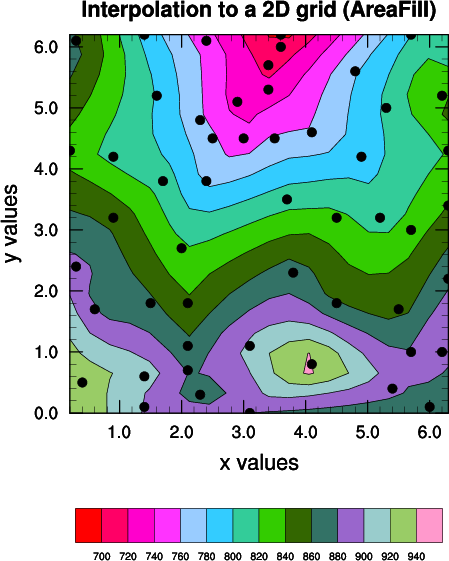
For an example on contouring random data (i.e. data represented by X, Y, and Z values), see contour_xyz.py (output).
For an example on using masked arrays, see overlay1.py (output).