
Ngl.xy
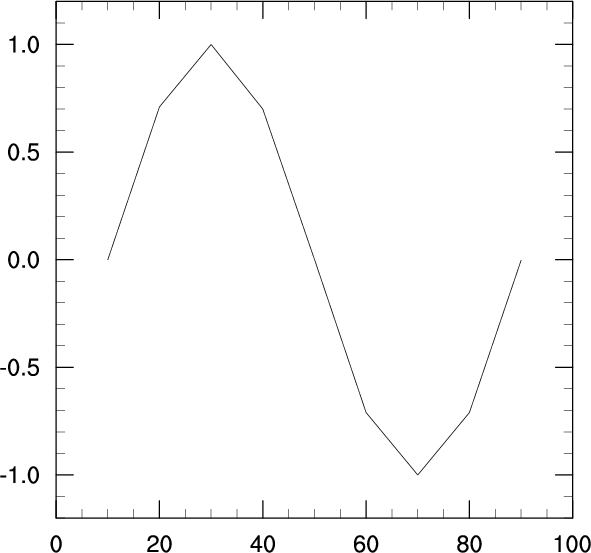
Creates and draws an XY plot.
Prototype
xyplot = Ngl.xy(wks, x, y, res=None)
Arguments
wksThe identifier returned from calling Ngl.open_wks.
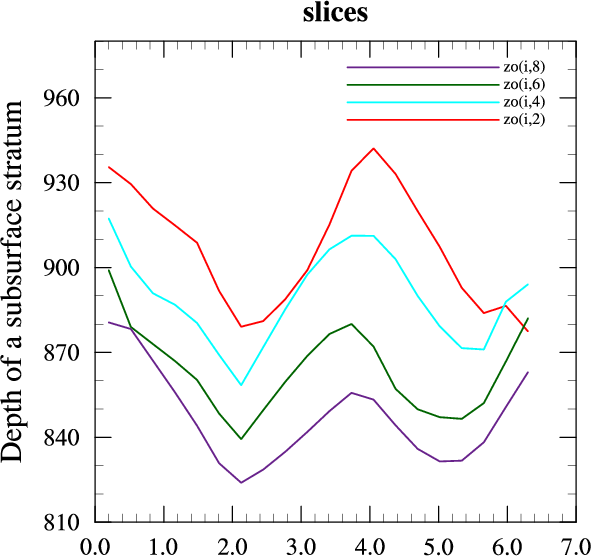
x, yThe X and Y coordinates of the curve(s). These values can be one-dimensional NumPy arrays, NumPy masked arrays, Python lists or two-dimensional NumPy arrays. If x and/or y are two-dimensional, then the leftmost dimension determines the number of curves.
res=NoneAn (optional) instance of the Resources class having PyNGL resources as attributes.
Return value
xyplotA PlotId representing the XY plot created.
Description
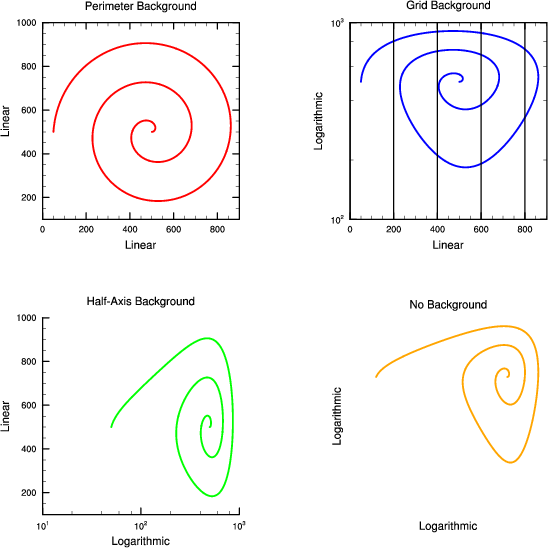
This function creates and draws an XY plot on the given workstation and advances the frame. Plot options can be set via the res variable.
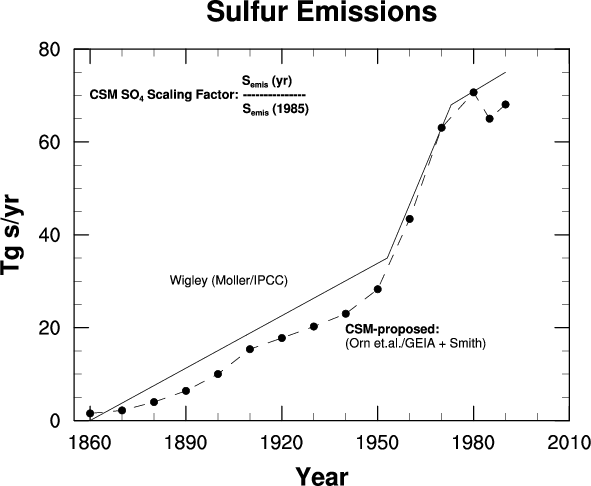
As of version 1.3.0, if x and/or y are masked arrays, then any values equal to the corresponding fill values will not be plotted. If x and/or y are not masked arrays and they contain missing values, then set the resources caXMissingV and/or caYMissingV to these values.
Note that PyNGL internally sets some resources for you, depending on how other resources are set. See the list of default settings for more information.
See Also
Ngl.y, Ngl.polyline, Ngl.polymarker, Ngl.polygon, Ngl.add_polyline, Ngl.add_polymarker, Ngl.add_polygon
XyPlot resources
Legend resources
CoordArrays resources
Title resources
TickMark resources
Transformation resources
View resources
Transform resources
PlotManager resources
Special "ngl" resources
Examples
See ngl01p.py (output), ngl08p.py (output), ngl10p.py (output), xy1.py (output), or any of the XY plots in the gallery.