
Ngl.vector_map
Creates and draws a vector plot over a map.
Prototype
vmap = Ngl.vector_map(wks, u, v, res=None)
Arguments
wksThe identifier returned from calling Ngl.open_wks.
u, vThe U and V components of the vectors. u and v should be two-dimensional NumPy arrays or NumPy masked arrays (dimensioned ny x nx).
res=NoneAn (optional) instance of the Resources class having PyNGL resources as attributes.
Return value
vmapA PlotId representing the vector plot created.
Description
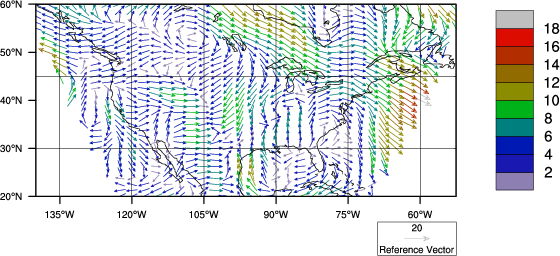
This function creates and draws vectors over a map on the given workstation and advances the frame. Plot options can be set via the res variable.
In order to overlay vectors on a map plot, you must tell the vector plot where on the map it is being overlaid (in latitude/longitude degrees). You can do this via the vfXArray/vfYArray resources, or the vfXCStartV/vfXCEndV/vfYCStartV/vfYCEndV resources.
As of version 1.3.0, if u and/or v are masked arrays, then any values equal to the corresponding fill values will not be plotted. If u and/or v are not masked arrays and they contain missing values, then set the resources vfMissingUValueV and/or vfMissingVValueV to these values.
Note that PyNGL internally sets some resources for you, depending on how other resources are set. See the list of default settings for more information.
See Also
Ngl.vector, Ngl.vector_scalar, Ngl.vector_scalar_map, Ngl.streamline, Ngl.streamline_map,
MapPlot resources
VectorPlot resources
VectorField resources
LabelBar resources
Title resources
TickMark resources
Transformation resources
View resources
Transform resources
PlotManager resources
Special "ngl" resources
Examples
See ngl06p.py (output) and vector_pop.py (output).