
PyNGL > tutorial examples > 1 | 2 | 3 | 4 | 5 | 6 | 7 | 8 | 9 | 10 | 11
Example 4 - streamline plots
This example reads in a netCDF file and creates three streamline plots.To find out more about netCDF, see http://my.unidata.ucar.edu/content/software/netcdf/.
To run this example, you must have Numerical Python installed in your Python implementation. Numerical Python (also known as "NumPy") is a Python module allowing for efficient array processing. This example reads in a GRIB1 file, so you will need to have the Nio module (this module comes with PyNGL).
There are two ways to run this example:
execute
pynglex ngl04p
or
download
ngl04p.pyand type:
python ngl04p.py
Output from example 4
| Frame 1 | Frame 2 | Frame 3 |
|---|---|---|
| 
| 
|
(Click on any frame to see it enlarged.)
  0. #
  1. #  Import NumPy and types.
  2. #
  3. import numpy, types
  4.
  5. #
  6. #  Import Nio.
  7. #
  8. import Nio
  9.
 10. #
 11. #  Import Ngl support functions.
 12. #
 13. import Ngl
 14. #
 15. #  Open the netCDF file.  This file is a netCDF version of the file:
 16. #
 17. #     pynglpath("data") + "/grb/ced1.lf00.t00z.eta.grb"
 18. #
 19. file = Nio.open_file(Ngl.pynglpath("data") + "/cdf/ced1.lf00.t00z.eta.grb","r")
 20.
 21. names = file.variables.keys()  #  Get the variable names
 22. print "\nVariable names:"      #  and print them out.
 23. print names
 24.
 25.
 26. #
 27. #  For variable in names[1], retrieve and print all attributes
 28. #  and their values.
 29. #
 30. print "\nThe attributes and their values for variable " + names[1] + ":"
 31. for attrib in file.variables[names[1]].attributes.keys():
 32.   t = getattr(file.variables[names[1]],attrib)
 33.   print "Attribute " + "'" + attrib + "' has value:", t
 34.
 35.
 36. #
 37. #  For variable in names[1], retrieve and print the dimension names.
 38. #
 39. print "\nFor variable " + names[1] + " the dimension names are:"
 40. print file.variables[names[1]].dimensions
 41.
 42. #
 43. #  Open a workstation.
 44. #
 45. wks_type = "ps"
 46. wks = Ngl.open_wks(wks_type,"ngl04p")
 47.
 48. #----------- Begin first plot -----------------------------------------
 49. resources = Ngl.Resources()
 50. #
 51. #  Get the u/v variables.
 52. #
 53.
 54. uvar = file.variables["U_GRD_6_ISBL"]
 55. vvar = file.variables["V_GRD_6_ISBL"]
 56.
 57. #
 58. #  Set resources and plot.
 59. #
 60. if hasattr(uvar,"units"):
 61.   resources.tiMainString = "GRD_6_ISBL (u,v " + uvar.units + ")"
 62. else:
 63.   resources.tiMainString = "GRD_6_ISBL"
 64.
 65. if hasattr(uvar,"_FillValue"):
 66.   resources.vfMissingUValueV = uvar._FillValue
 67. if hasattr(vvar,"_FillValue"):
 68.   resources.vfMissingVValueV = vvar._FillValue
 69.
 70. resources.tiMainFont    = "Times-Roman"
 71. resources.tiXAxisString = "streamlines"
 72.
 73. plot = Ngl.streamline(wks,uvar[0,::2,::2],vvar[0,::2,::2],resources)
 74.
 75. #----------- Begin second plot -----------------------------------------
 76.
 77. del uvar
 78. del vvar
 79.
 80. uvar = file.variables["U_GRD_6_TRO"]
 81. vvar = file.variables["V_GRD_6_TRO"]
 82.
 83. #
 84. #  Set resources and plot.
 85. #
 86. if hasattr(uvar,"units"):
 87.   resources.tiMainString = "GRD_6_TRO (u,v " + uvar.units + ")"
 88. else:
 89.   resources.tiMainString = "GRD_6_TRO"
 90.
 91. if hasattr(uvar,"_FillValue"):
 92.   resources.vfMissingUValueV = uvar._FillValue
 93. if hasattr(vvar,"_FillValue"):
 94.   resources.vfMissingVValueV = vvar._FillValue
 95.
 96. resources.tiXAxisFont   = "Times-Roman"  # Change the default font used.
 97. resources.tmXBLabelFont = "Times-Roman"
 98. resources.tmYLLabelFont = "Times-Roman"
 99.
100. resources.stLineColor = "green"  # Change streamlines to green.
101.
102. plot = Ngl.streamline(wks,uvar[::2,::2],vvar[::2,::2],resources)
103.
104. #----------- Begin third plot -----------------------------------------
105.
106. arrowlength = Ngl.get_float(plot,"stArrowLengthF")
107. spacing = Ngl.get_float(plot,"stMinLineSpacingF")
108.
109. resources.stMinLineSpacingF = spacing * 2.0     # Set some resources based
110. resources.stArrowLengthF    = arrowlength * 2.0 # on resources you retrieved.
111. resources.stLineColor       = "red"             # Change line color to red
112. resources.stLineThicknessF  = 1.5
113.
114. uvar = file.variables["U_GRD_6_GPML"]
115. vvar = file.variables["V_GRD_6_GPML"]
116.
117. #
118. #  Set resources and plot.
119. #
120. if hasattr(uvar,"units"):
121.   resources.tiMainString = "GRD_6_GPML (u,v " + uvar.units + ")"
122. else:
123.   resources.tiMainString = "GRD_6_GPML"
124.
125. if hasattr(uvar,"_FillValue"):
126.   resources.vfMissingUValueV = uvar._FillValue
127. if hasattr(vvar,"_FillValue"):
128.   resources.vfMissingVValueV = vvar._FillValue
129.
130. plot = Ngl.streamline(wks,uvar[0,::2,::2],vvar[0,::2,::2],resources)
131.
132. del uvar
133. del vvar
134. del plot
135.
136. Ngl.end()
Explanation of example 4
Line 3:
import numpy, types
Import the Numerical Python module. You must have this module installed in your Python implementation. This module is used for efficient array processing. The names of the functions in the Numerical Python package are not exposed by this import, meaning that all functions and attributes in that package will have to be qualified with "numpy".
The Numerical Python package is also known as "NumPy".
import Nio
Import the GRIB1 reader from the Nio module. This module comes with the PyNGL package.
import Ngl
Import all of the Ngl functions. The Ngl module must be on your Python search path.
file = Nio.open_file(Ngl.pynglpath("data") + "/cdf/ced1.lf00.t00z.eta.grb","r")
Open the GRIB file in read mode.
  names = file.variables.keys()  #  Get the variable names
  print "\nVariable names:"      #  and print them out.
  print names
Retrieve all of the variable names in the netCDF file and print them out.
  print "\nThe attributes and their values for variable " + names[1] + ":"
  for attrib in file.variables[names[1]].attributes.keys():
    t = getattr(file.variables[names[1]],attrib)
    print "Attribute " + "'" + attrib + "' has value:", t
For the netCDF variable in names[1], get the attributes and print out the attribute values.
  print "\nFor variable " + names[1] + " the dimension names are:"
  print file.variables[names[1]].dimensions
For the netCDF variable names[1], retrieve and print its dimension names.
  wks_type = "ps"
  wks = Ngl.open_wks(wks_type,"ngl04p")
Open a workstation for drawing the streamline plots.
#----------- Begin first plot -----------------------------------------
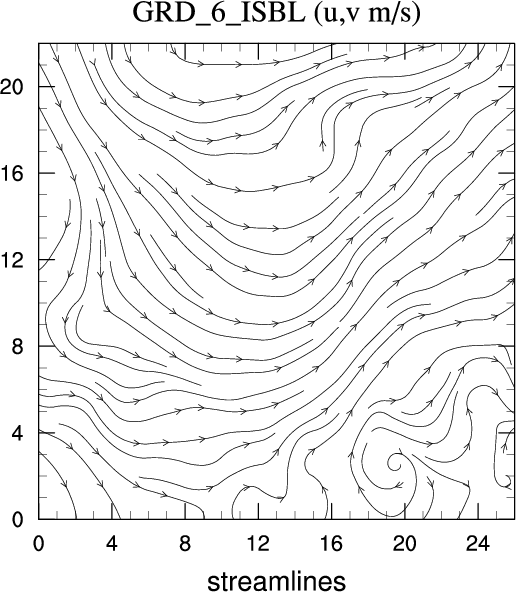
Draw a basic streamline plot with a title.
resources = Ngl.Resources()
Get ready to set up a list of resources for changing the look of the plot. See example 1 for an explanation on how resources are set. Streamline plot resources are part of the "StreamlinePlot" group and all start with the letters "st". They are documented in the StreamlinePlot descriptions resource section of the NCL Reference Manual.
Streamline plots use the same data field as vector plots, so the data associated with a streamline plot is called a "VectorField."
  uvar = file.variables["U_GRD_6_ISBL"]
  vvar = file.variables["V_GRD_6_ISBL"]
Associate Python variable with the netCDF variables U_GRD_6_ISBL and V_GRD_6_ISBL.
  if hasattr(uvar,"units"):
    resources.tiMainString = "GRD_6_ISBL (u,v " + uvar.units + ")"
  else:
    resources.tiMainString = "GRD_6_ISBL"
Specify a main title that depends on the units attribute of uvar.
  if hasattr(uvar,"_FillValue"):
    resources.vfMissingUValueV = uvar._FillValue
  if hasattr(vvar,"_FillValue"):
    resources.vfMissingVValueV = vvar._FillValue
Specify the vector field missing values if the netCDF variables have a _FillValue attribute.
  resources.tiMainFont    = "Times-Roman"
  resources.tiXAxisString = "streamlines"
Set some resources to change the default font of the title and to label the X axis. Remember: predefined strings, like those listed in the font table, are case-insensitive, and you could have specified the above font with "times-roman" or "TIMES-ROMAN" or any another combination of uppercase and lower case characters.
plot = Ngl.streamline(wks,uvar[0,::2,::2],vvar[0,::2,::2],resources)
Create and draw a streamline plot of the 2-dimensional arrays uvar and vvar. The first argument of the Ngl.streamline function is the workstation oject returned from the previous call to Ngl.open_wks. The next two arguments represent the 2-dimensional vector field to be plotted (they must have the same dimensions, be of NumPy type float, double, or integer, and be ordered Y x X). The last argument is the resource list. The resources you set here are just for titling the plot and for labeling the X axis.
The syntax ::2 is being used to "thin" the streamlines; that is, only every other data point is passed on to the plotting function.
The default streamline plot drawn contains labeled tick marks. Since no ranges have been defined for the X and Y axes in this plot, the range values default to 0 to n-1, where n is the number of points in that dimension.
#----------- Begin second plot -----------------------------------------
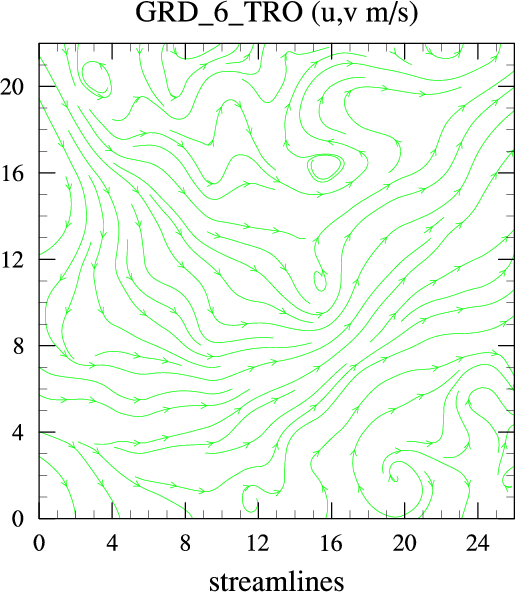
Create a streamline plot using a different dataset, drawing the streamlines in color, and changing the font of the titles and labels in the plot.
  del uvar
  del vvar
Delete the variables uvar and vvar since you are going to use these variables again. This is only necessary if you plan to assign data to uvar and vvar that is of a different type or dimensionality than when you originally initialized these two variables.
  uvar = file.variables["U_GRD_6_TRO"]
  vvar = file.variables["V_GRD_6_TRO"]
Retrieve the variables U_GRD_6_TRO and V_GRD_6_TRO from the GRIB file. These two variables are 2-dimensional NumPy arrays.
  if hasattr(uvar,"units"):
    resources.tiMainString = "GRD_6_TRO (u,v " + uvar.units + ")"
  else:
    resources.tiMainString = "GRD_6_TRO"
Again, check if the variable in question has an attribute called "units", and if so, use it to create part of the main title.
  if hasattr(uvar,"_FillValue"):
    resources.vfMissingUValueV = uvar._FillValue
  if hasattr(vvar,"_FillValue"):
    resources.vfMissingVValueV = vvar._FillValue
Specify the vector field missing values if the netCDF variables have a _FillValue attribute.
  resources.tiXAxisFont   = "Times-Roman"  # Change the default font used.
  resources.tmXBLabelFont = "Times-Roman"
  resources.tmYLLabelFont = "Times-Roman"
Set some resources for changing the font of the X axis and the labels for the tick marks. Tick mark resources are part of the TickMark group and start with the letters "tm". They are documented in the TickMark resource descriptions section of the NCL Reference Manual. The "XB" in tmXBLabelFont stands for "X bottom" and the "YL" in tmYLLabelFont stands for "Y left."
There are ways for setting fonts globally rather than having to set each font individually, and these are covered in example 8.
resources.stLineColor = "green" # Change streamlines to green.
Change the color of the streamlines to green using the named colors capability of PyNGL. There are 650 valid color names you can use, but your color map must contain the named color you want to use or else PyNGL will use the closest match. For example, if your color map contains the following RGB values in a NumPy array:
[[0.,0.,0.],[1.,1.,1.],[1.,0.,0.],[0.,1.,0.],[0.,0.,1.]]
and you reference the color "CornflowerBlue" which is represented by
the RGB value [0.39215,0.58431,0.92941], then the closest match in
your color map is [0.,0.,1.], and you will get a regular blue color
instead of cornflower blue which is lighter. To assure that your
color map contains the named colors you want to reference, add them
specifically to your color map. PyNGL example 7 shows how to set a color map using named
colors.For more information on named colors, see "Creating your own color map using named colors and RGB values".
plot = Ngl.streamline(wks,uvar[::2,::2],vvar[::2,::2],resources)
Draw the new streamline plot using the new resources you just set.
#----------- Begin third plot -----------------------------------------
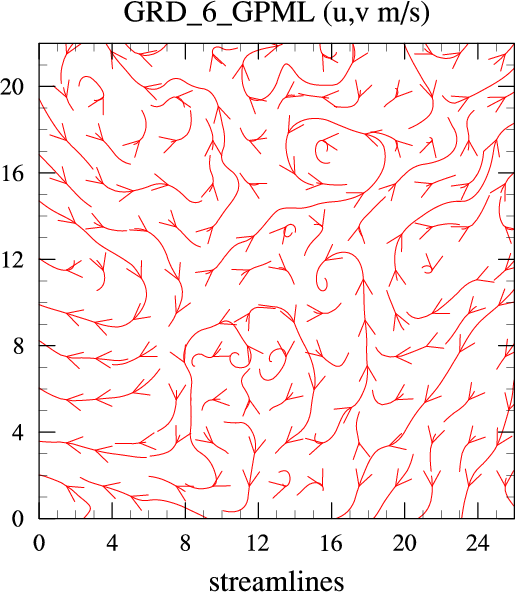
Create a streamline plot using a different dataset, changing the thickness and color of the streamlines, changing the length of the streamline arrows, and changing the spacing between streamlines.
  arrowlength = Ngl.get_float(plot,"stArrowLengthF")
  spacing = Ngl.get_float(plot,"stMinLineSpacingF")
As noted in the first example, resources have default values. Some resources are set dynamically according to any number of things, like the size of the plot, the minimum and maximum values of the data, etc. There may be cases where you need to retrieve the value of one or more of these dynamic resources so you can change them or use their values to change other resources. The resources stArrowLengthF and stMinLineSpacingF are two examples of dynamic resources whose values you can retrieve so you can change them.
Resource values in PyNGL are retrieved using the Ngl.get_xx functions, where xx is appropriate to the type of value you are retrieving:
        Ngl.get_float
        Ngl.get_integer
        Ngl.get_string
        Ngl.get_integer_array
        Ngl.get_float_array
        Ngl.get_string_array
        Ngl.get_MDfloat_array
        Ngl.get_MDinteger_array
where the arrays are 1D, unless the MD (multiple dimension)
prefix is present.
  resources.stMinLineSpacingF = spacing * 2.0     # Set some resources based
  resources.stArrowLengthF    = arrowlength * 2.0 # on resources you retrieved.
  resources.stLineColor       = "red"             # Change line color to red
  resources.stLineThicknessF  = 1.5
Now that the values for stMinLineSpacingF and stArrowLengthF have been retrieved and stored to the variables spacing and arrowlength respectively, you can use these values to change these resources. The spacing between streamlines is increased by a factor of four, and the arrow length of the streamlines is doubled. The last two resources change the line color to red and increase the line thickness by 50 percent (the default is 1).
  if hasattr(uvar,"units"):
    resources.tiMainString = "GRD_6_GPML (u,v " + uvar.units + ")"
  else:
    resources.tiMainString = "GRD_6_GPML"
Change the main title to reflect the new data that you are using to create a streamline plot.
  if hasattr(uvar,"_FillValue"):
    resources.vfMissingUValueV = uvar._FillValue
  if hasattr(vvar,"_FillValue"):
    resources.vfMissingVValueV = vvar._FillValue
Specify the vector field missing values if the netCDF variables have a _FillValue attribute.
plot = Ngl.streamline(wks,uvar[0,::2,::2],vvar[0,::2,::2],resources)
Draw the new streamline plot, using the new resources you just set.
Ngl.end()
Required to end the script.