
New users
Introduction
This is the place to start if you are new to PyNGL and PyNIO.PyNGL (pronounced "pingle") is a Python language module used to visualize scientific data, with an emphasis on high quality 2D visualizations. A working knowledge of Python is assumed.
The NumPy extension module is used for array processing
PyNIO is a Python module used for reading and writing files in several different data formats, including netCDF, netCDF 4, GRIB1, GRIB2, HDF 4, HDF-EOS 2 and HDF-EOS5, and CCM history files. See the documentation on PyNIO for more details.
Graphic output overview
Please browse the image gallery to see the kind of visualizations that PyNGL can produce and how to use PyNIO to read in various data formats.Output formats are: PostScript, PDF, PNG, X11 screen, or NCGM.
Availability
PyNGL, as well as the associated modules PyNIO and NumPy, are all freely available. For PyNGL and PyNIO, see Downloading and installing PyNGL and PyNIO; for NumPy, go to the SourceForge download page.A brief history
PyNGL and PyNIO provide Python interfaces to most of the graphics and file input/output functionality existing in the NCAR Command Language (NCL). A knowledge of NCL would give you a leg up in using these modules, but they are meant to be independent from NCL and used as a stand-alone suite of Python functions. In a few circumstances where the NCL documentation applies directly to PyNGL and PyNIO and there is no ambiguity, links are made to the NCL documentation from the PyNGL documentation.PyNGL and PyNIO represent recent developments in the evolution of a package that dates back several decades. Those who are interested can view the genealogical chart.
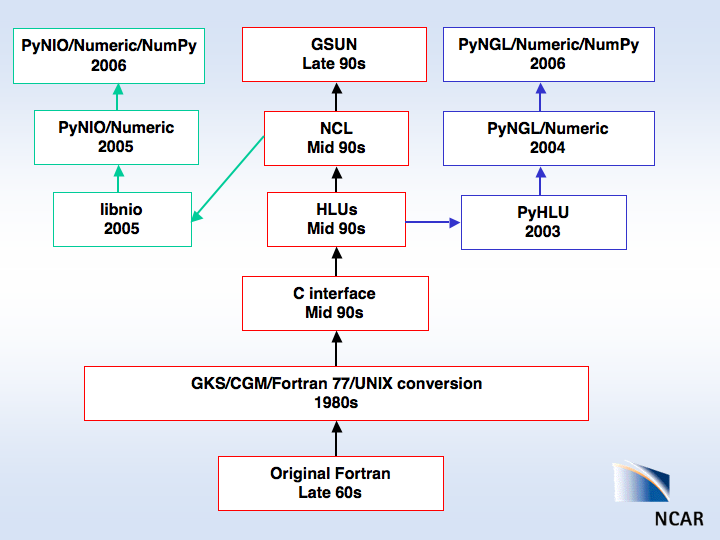
Getting started
After having read this page, you should go to the Tutorial which presents a sequence of example codes of increasing complexity. For each example, line-by-line comments are provided.All PyNGL codes have the same basic code structure:
- read in data
- process the data
- specify a graphic output device
- specify resources that control plot appearance
- call a plotting function
As a new user you will probably find the resource specifications to have the steepest learning curve, since there are well over a thousand of them controlling, for example, whether your tick marks point in or out, how many contour lines you want, what font to use, what color table to use, and so forth. There are three relevant pages relating to resources:
| link | description |
|---|---|
| Resources overview | A brief introduction describing what resources are and how they are used. |
| Resource files | A discussion of how to set multiple resource values by putting them in files. |
| Resources documentation | Links (ordered alphabetically as well as grouped by resource type) to documentation for all resources. |
You will have a good start on understanding some of the most common resources after having gone through the tutorial.
Module contents
The links on the sidebar of the PyNGL home page give an overview of what PyNGL is. The following tables summarize where the links on the sidebar will take you. It might help you to click through the links to get a feel for what's there. Clicking on "PyNGL" in the page header for any page will take you back to the home page.Examples menu
| link | description |
|---|---|
| overview | a description of how to run the examples |
| gallery | lists all example images with links to the sources |
| alphabetical | alphabetical list of the examples with brief descriptions |
| by category | lists example categories with links to images |
| by function | for a given PyNGL function, lists the examples that use that function |
| by resource | for a given PyNGL resource name, lists the examples that use that resource |
| by effect | lists various graphic effects and the examples that illustrate those |
Links menu
| link | description |
|---|---|
| What's new | lists the important new things in each version |
| Tutorial | a sequence of examples with line-by-line explanations |
| Functions | lists all of the available PyNGL functions |
| Resources | lists all of the available PyNGL resources |
| PyNIO | link to the PyNIO documentation |
| Colors | description of color usage and a gallery of color tables |
| FAQ | Frequently asked questions |
| User forum | how to subscribe to the pyngl-talk mailing list |
| Quick links | Links to various color and pattern tables, etc. |
| Related URLs | listing of external URLs of interest |
| Bugs | list of known bugs and instructions on filing a bug report |
| Glossary | glossary |
| Download | Instructions on how to download and install PyNGL and PyNIO |
Acknowledgements
Authors: Fred Clare, Dave Brown, and Mary HaleyPyNGL and PyNIO use several other publicly-available software packages for some of their file I/O and data analysis routines. Please see the full list of contributors.
The National Center for Atmospheric Research is sponsored by the National Science Foundation. Any opinions, findings and conclusions or recommendations expressed in this publication are those of the author(s) and do not necessarily reflect the views of the National Science Foundation.
© Copyright: 1998-2010 University Corporation for
Atmospheric Research (UCAR)
The use of this software is governed by License Agreements.