
Color maps
Color maps, also known as color tables, are generally represented by n x 3 arrays of red, green, and blue float values (referred to as RGB values) ranging from 0.0 to 1.0 (to indicate the intensity of that particular color). The first entry in a color map is the background color, and the second entry is the foreground color.PyNGL uses a default rainbow color map that contains 190 different colors. If you want to define your own color map, then you can do it one of several ways:
- by using one of several predefined color maps (the default being one of them),
- by defining a set of RGB values,
- by defining a combination of named colors and RGB values
- by using HSV values,
- by merging two color maps, or
- by creating a color map file that you can reference by name.
In the discussions below you will notice that the wkColorMap resource, which is used to define the color map for a particular workstation, can take on three different types of values: a 2-dimensional Numerical float array, a single string, or a list of strings.
Using a predefined color map
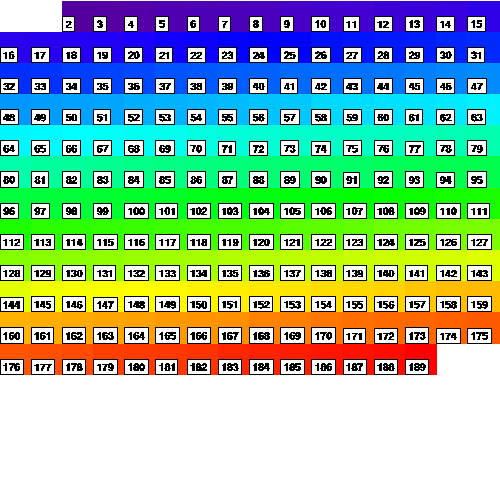
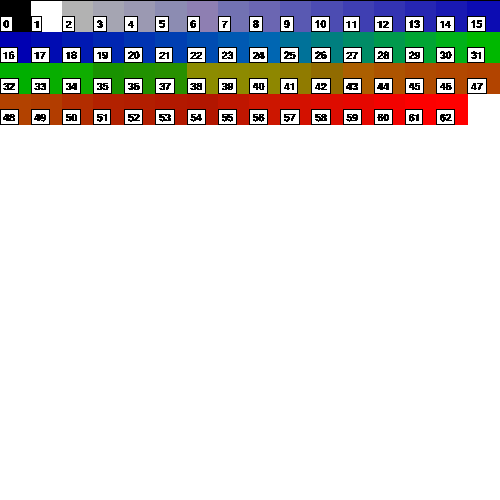
PyNGL provides several predefined color maps that range from 8 color entries to 255 color entries. It uses the one called "rainbow" if you don't create your own color map.To use one of the other predefined color maps, select one from the color table gallery, and set the resource wkColorMap to this name. For example, if you want to use the "temp1" color map before opening a workstation, include the following statements:
rlist = Ngl.Resources()
rlist.wkColorMap = "temp1"
wks = Ngl.open_wks("ncgm","wks_name",rlist)
If you want to change the color map associated with an existing workstation to temp1, then include the the following:
rlist = Ngl.Resources()
rlist.wkColorMap = "temp1"
Ngl.set_values(wks,rlist)
Creating your own color map using RGB values
To create your own color map using RGB values, define a 2-dimensional Numerical float array dimensioned n x 3, where the first dimension represents the number of colors (n), and the second dimension represents the RGB values. Then, apply the newly-defined color map to a workstation in one of the two ways described in the "Using a predefined color map" section above.For example, if you open a workstation and create a color map array with the following PyNGL code:
wks = Ngl.open_wks("x11","example")
cmap = numpy.array([[1.00, 1.00, 1.00], [0.00, 0.00, 0.00], \
                    [1.00, 0.00, 0.00], [1.00, 0.00, 0.40], \
                    [1.00, 0.00, 0.80], [1.00, 0.20, 1.00], \
                    [1.00, 0.60, 1.00], [0.60, 0.80, 1.00], \
                    [0.20, 0.80, 1.00], [0.20, 0.80, 0.60], \
                    [0.20, 0.80, 0.00], [0.20, 0.40, 0.00], \
                    [0.20, 0.45, 0.40], [0.20, 0.40, 0.80], \
                    [0.60, 0.40, 0.80], [0.60, 0.80, 0.80], \
                    [0.60, 0.80, 0.40], [1.00, 0.60, 0.80]],'f')
then you can make this new color map active with the statements:
rlist = Ngl.Resources()
rlist.wkColorMap = cmap
Ngl.set_values(wks,rlist)
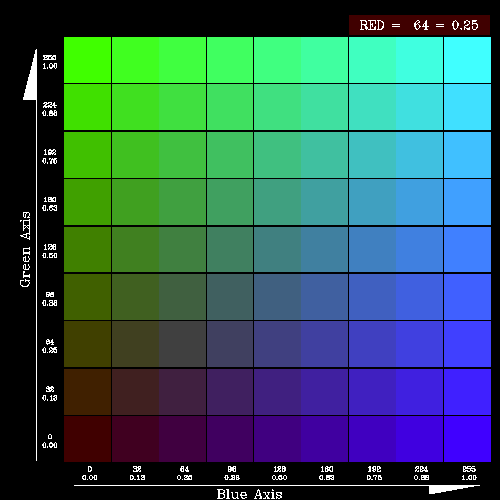
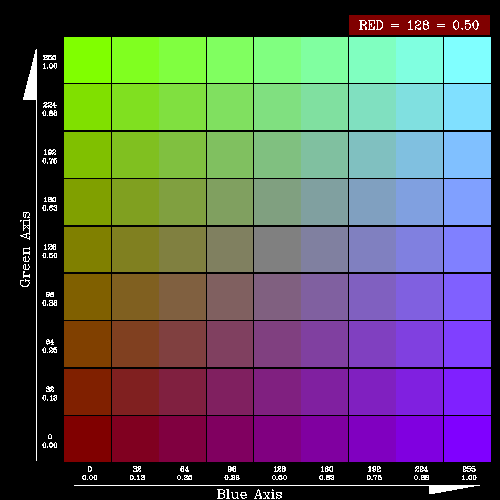
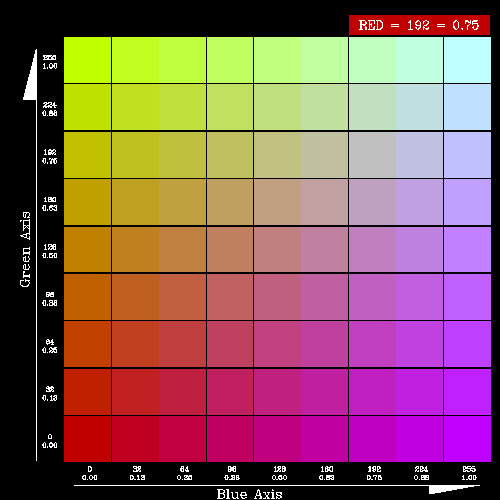
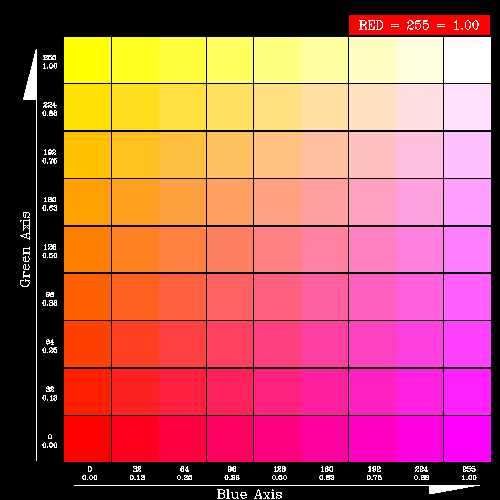
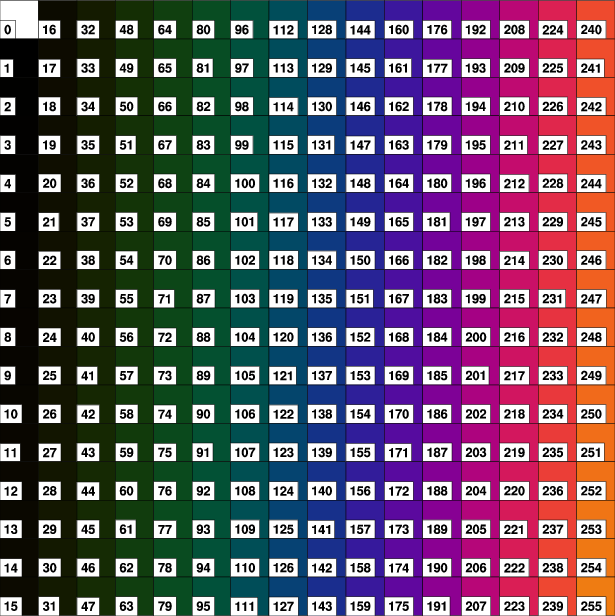
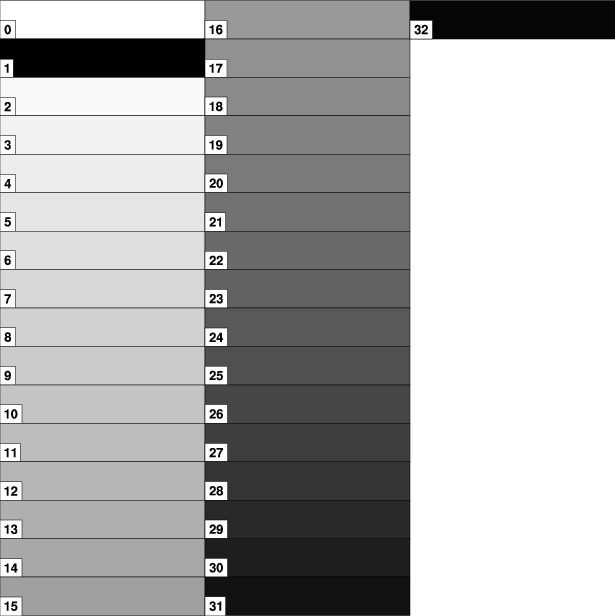
To help determine what RGB values to use to get the colors you want, below are five color tables with sample RGB values. Each table has a fixed intensity value for red, and shows the colors for varying intensity values of blue and green:
| Table 1 | Table 2 | Table 3 | Table 4 | Table 5 |
|---|---|---|---|---|
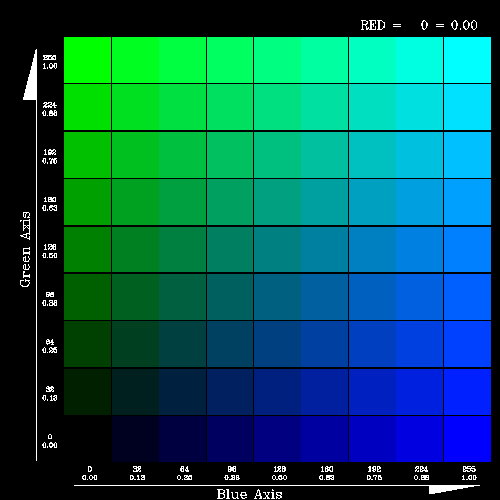
|
|
|
|
|
| (Click on any table to see it enlarged.) | ||||
Note: To create a grayscale color map, use RGB values that are equal in intensity. For example, [0.11, 0.11, 0.11], [0.5, 0.5, 0.5], and [0.968, 0.968, 0.968] are all RGB values that produce varying shades of gray.
Creating your own color map using named colors
Colors in a color map can be specified by using color names. The color map in this case will be a list of named colors. There are 650 valid named colors as listed in the last column of the "color name file." You can also see the color names and their associated colors by clicking on any one of the 15 tables below:

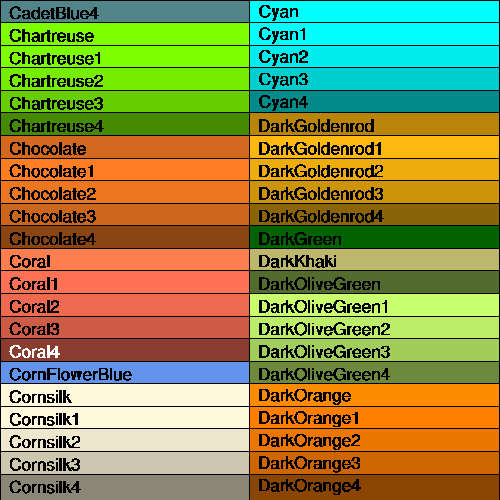
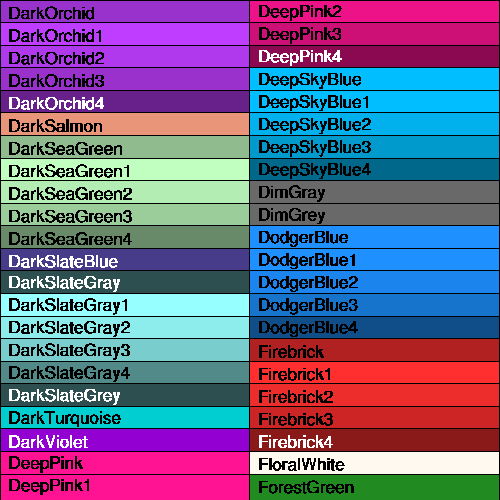
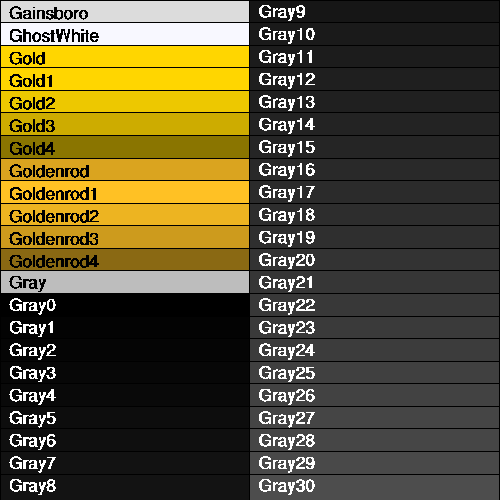
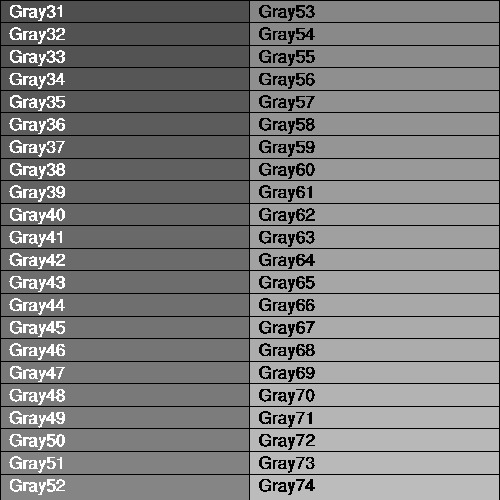
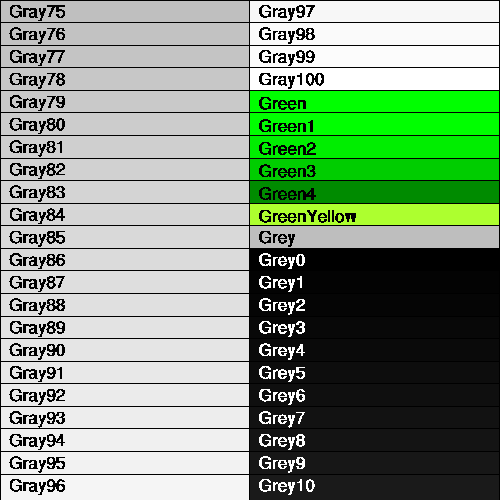
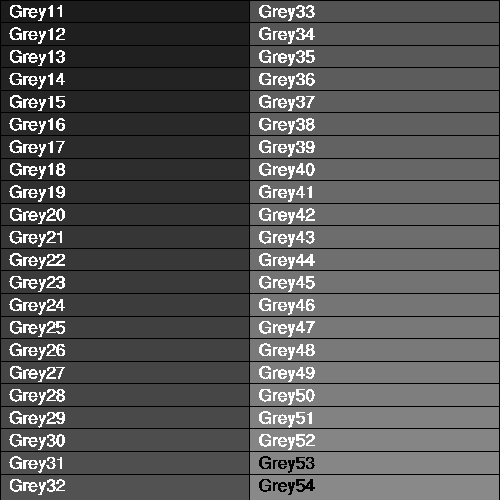
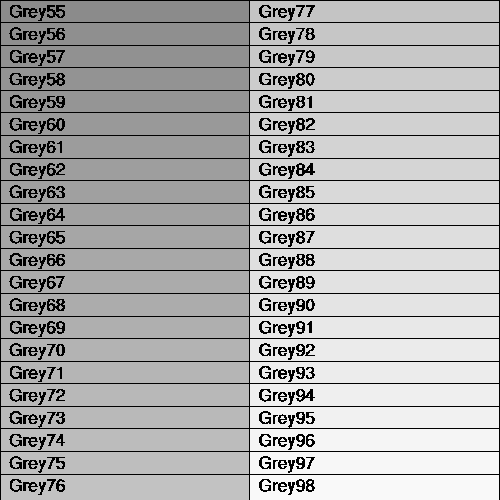
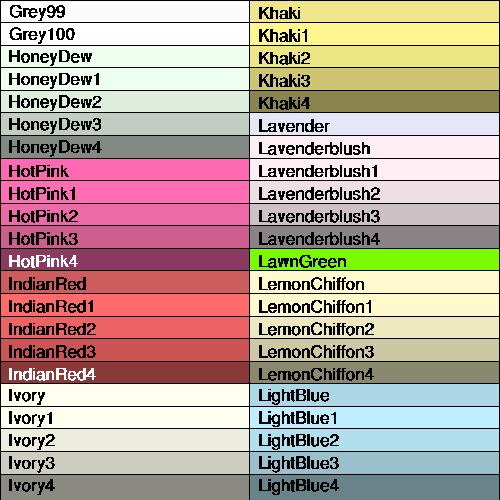
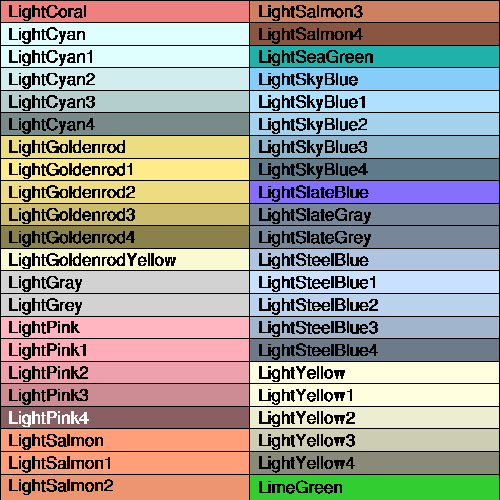
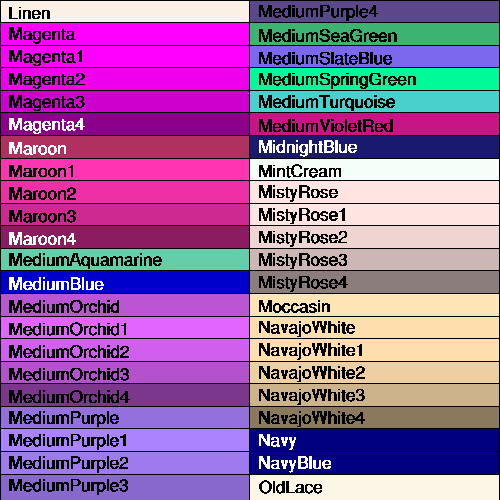
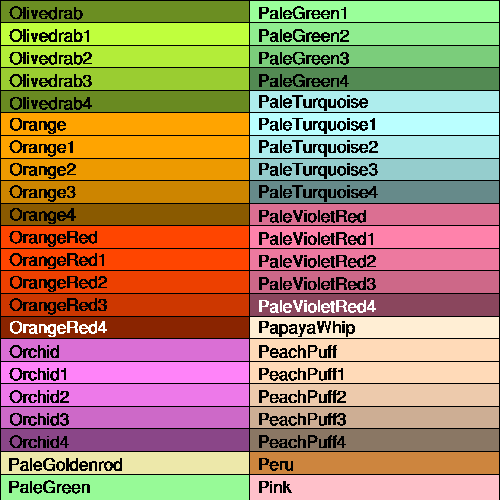
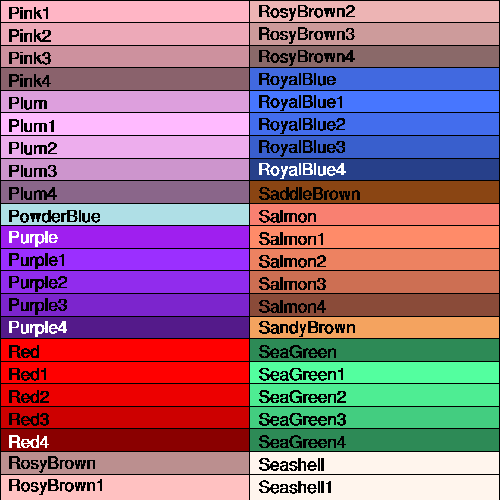
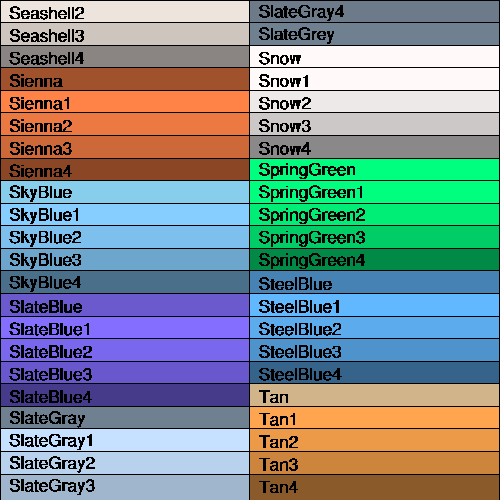
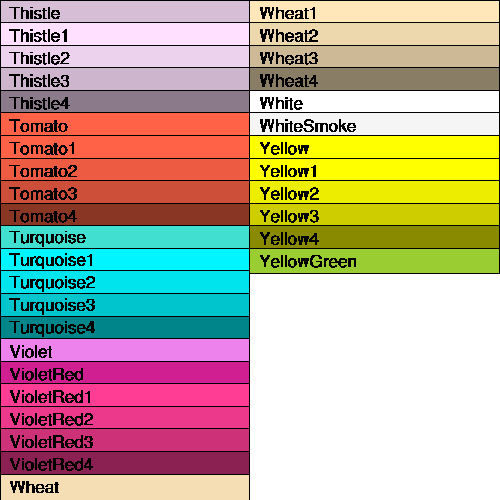
(Note that some of the colors are duplicates, like "grey1" and "gray1".)
You can specify named colors for a given workstation as follows:
cmap = ["Black","White", "CadetBlue", "Ivory", "LimeGreen", "DarkSalmon"]
rlist = Ngl.Resources()
rlist.wkColorMap = cmap
wks = Ngl.open_wks("ncgm","wks_name",rlist)
If the workstation is already defined, then you can use one of these two methods:
wks = Ngl.open_wks("ncgm","wks_name")
cmap = ["Black","White", "CadetBlue", "Ivory", "LimeGreen", "DarkSalmon"]
rlist = Ngl.Resources()
rlist.wkColorMap = cmap
Ngl.set_values(wks,rlist)
The following method is only available in version 1.2.0:
cmap = ["Black","White", "CadetBlue", "Ivory", "LimeGreen", "DarkSalmon"]
Ngl.define_colormap(wks,cmap)
There is a way to mix RGB and named colors in the specification of a color map; the syntax is rather strange due to compatibility issues with the underlying software. This is discussed in a note in tutorial example 7.
Creating your own color map using HSV values
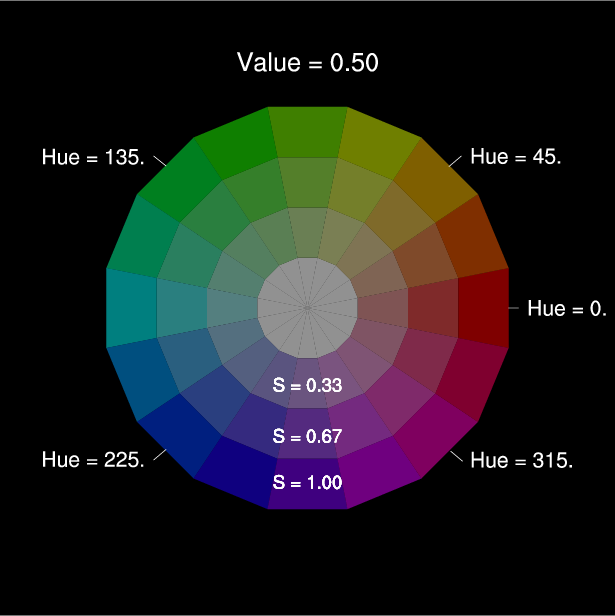
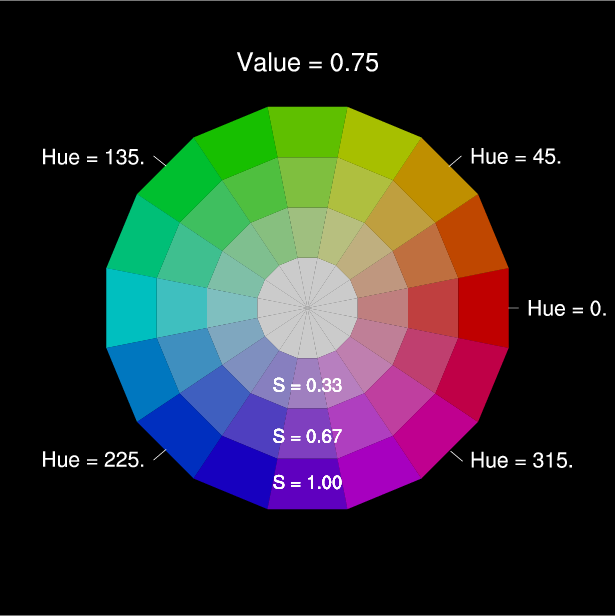
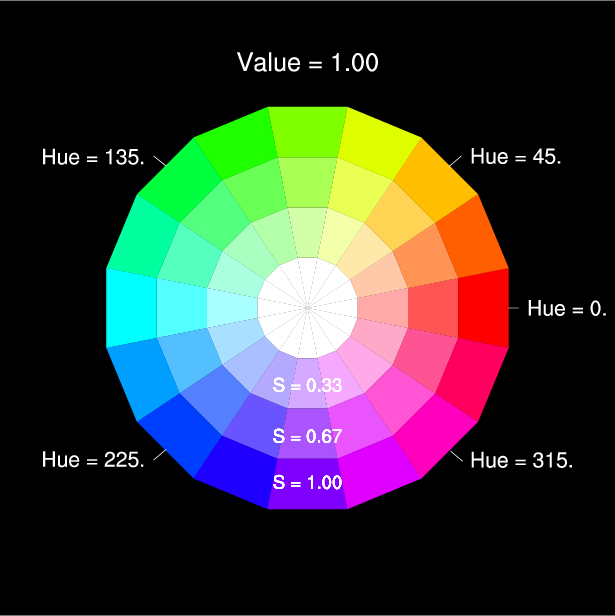
To define a color map using HSV values, there's a PyNGL function called Ngl.hsvrgb that you can use to convert from individual RGB triples to HSV (hue, saturation, value) triples.In the HSV color space, H represents the hue and must be in the range [0.,360.], S represents the saturation (percentage of white) and must be in the range [0.,1.0], V represents the value (brightness or intensity) and must be in the range [0.,1.].
Below are three sample color wheels (with HSV values included) to help you select values to use in the Ngl.hsvrgb function. Each wheel has a fixed value for V, and shows the colors at varying degrees of H for three different fixed values for S:
| Wheel 1 | Wheel 2 | Wheel 3 |
|---|---|---|
|
|
|
| (Click on any "wheel" to see it enlarged.) | ||
For example, let's assume you want a color map with 18 entries: a white background, a black foreground, and the rest of the 16 colors ranging from blue to red (no green). Let's further assume you want to use a fixed intensity value of 1.0 and a fixed saturation of 0.67. Then your PyNGL code might look like the following:
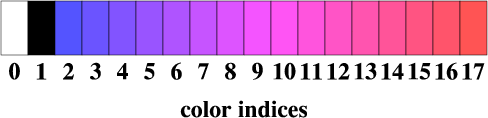
import numpy
import Ngl

ncolors = 16    # Plus two colors for background and foreground.

hmin    = 240.
hmax    = 360.

#
#  Select hues from blue to red.
#
hue = numpy.arange(hmin,hmax+1.,(hmax-hmin)/(ncolors-1))
sat = 0.67*numpy.ones(ncolors)
val =      numpy.ones(ncolors)

#
#  Define color map with 18 colors.
#
cmap = numpy.zeros((ncolors+2,3),'f')
cmap[0] = [1.,1.,1.]  # white background
cmap[1] = [0.,0.,0.]  # black foreground

#
#  Get the rgb values for the hsv selections.
#
for i in range(2,ncolors+2):
  cmap[i] = Ngl.hsvrgb(hue[i-2],sat[i-2],val[i-2])

rlist = Ngl.Resources()
rlist.wkColorMap = cmap
wks = Ngl.open_wks("ps","cmap18",rlist)

#
#  Draw a rectangle for each color, draw a black box around it,
#  and label the boxes with the color indices.
#
gsres = Ngl.Resources()
textres  = Ngl.Resources()
textres.txFontHeightF = 0.03
delx = 0.05
yb = 0.85
yt = 0.95
for i in range(ncolors+2):
  gsres.gsFillColor = i
  xl = 0.05*(i+1)
  xr = xl+delx
  Ngl.polygon_ndc(wks,[xl,xr,xr,xl,xl],[yb,yb,yt,yt,yb],gsres)
  gsres.gsFillColor = 1
  Ngl.polyline_ndc(wks,[xl,xr,xr,xl,xl],[yb,yb,yt,yt,yb],gsres)
  Ngl.text_ndc(wks,"~F26~" + str(i), 0.5*(xl+xr), yb-0.03, textres)

Ngl.text_ndc(wks,"~F26~color indices",.5,yb-0.1,textres)

Ngl.frame(wks)
Ngl.end()
The above code produces a color table that looks like this:
Merging two color maps
To merge two color maps, use the PyNGL function Ngl.merge_colormaps. The color maps can be predefined color map names and/or Numerical arrays of n x 3 RGB values. The combination of the two color maps must not be more than 256 colors (the background/foreground colors will be dropped from the second color map).
. . .
wks = Ngl.open_wks("x11","example")
Ngl.merge_colormaps(wks,"temp1","uniform")
. . .
where wks is the id of the workstation.
Retrieving the current color map
To retrieve the current color map in use, use either the PyNGL function Ngl.retrieve_colormap:
. . .
wks = Ngl.open_wks("x11","example",rlist)
. . .
cmap = Ngl.get_MDfloat_array(wks,"wkColorMap")
. . .
where wks is the id of the workstation. cmap will be an n x 3 Numerical float array of RGB values, where n is the number of colors in the color map.
Drawing the current color map
To draw the current color map in use, use the PyNGL function Ngl.draw_colormap:
. . .
wks = Ngl.open_wks("x11","example")
Ngl.draw_colormap(wks)
. . .
where wks is the id of the workstation. For an example on how to draw all the predefined colormaps, see color1.py script (see first two frames: one and two).