
Ngl.skewt_plt
Plots soundings and (optionally) winds on Skew T, Log P charts created by Ngl.skewt_bkg.
Prototype
splt = Ngl.skewt_plt(wks, bkgd, P, TC, TDC, Z,
                      WSPD, WDIR, dataOpts=None)
Arguments
wksThe identifier returned from calling Ngl.open_wks.
bkgdThe identifier returned from calling Ngl.skewt_bkg.
PAn array of pressure values (mb/hPa). Can be a masked array.
TCAn array of the same length as P containing temperature values. Can be a masked array.
By default temperatures are assumed to be in Fahrenheit units. Use the resource sktTemperatureUnits to specify Celsius, if that is desired.
TDCAn array of the same length as P containing dew point temperature values. Can be a masked array.
By default temperatures are assumed to be in Fahrenheit units. Use the sktTemperatureUnits resource to specify Celsius if that is desired.
ZAn array of the same length as P containing geopotential values (gpm). Can be a masked array.
WSPDAn array of the same length as P containing wind speed values (knots or m/s). Can be a masked array.
WDIRAn array of the same length as P containing meteorological wind direction values. Can be a masked array.
dataOpts=NoneAn (optional) instance of the Resources class having special "skt" resources as attributes.
Return value
spltA PlotId of the Skew-T plot created is returned.
Description
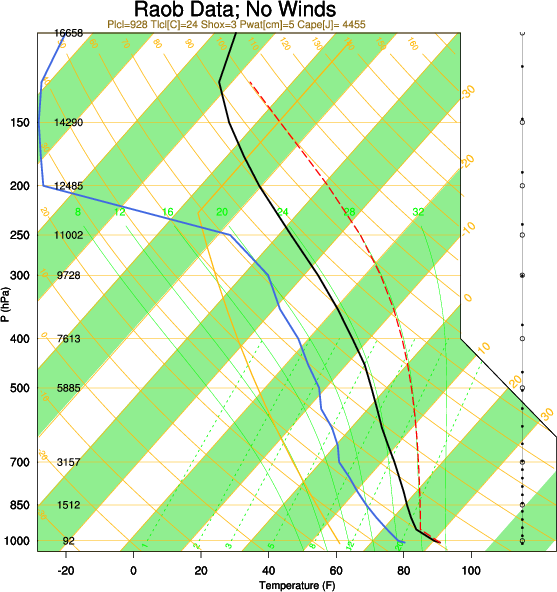
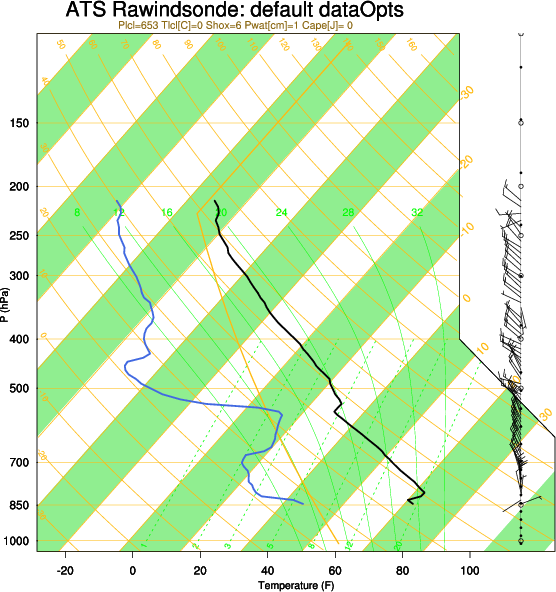
This function plots soundings on a Skew T, Log P background chart that was created by Ngl.skewt_bkg.
The definition of a Skew T, Log P diagram, taken from a weather site on the web, is "A thermodynamic diagram, using the temperature and the logarithm of pressure as coordinates. It is used to evaluate and forecast air parcel properties. Some values that can be determined are the Convective Condensation Level (CCL), the Lifting Condensation Level (LCL), and the Level of Free Convection (LFC)."
For an overview of the information on a Skew T chart, see:
http://twister.sbs.ohio-state.edu/helpdocs/skew_T_help.html
As of version 1.3.0, Ngl.skewt_plt automatically handles missing values if the input arrays are masked arrays. Otherwise, missing values have to be specifically set via the appropriate sktXXXMissingV resources.
If Ngl.skewt_plt is called after a call to Ngl.skewt_bkg, then you will need to call Ngl.draw to plot the result, since Ngl.skewt_bkg sets nglDraw and nglFrame to False. In fact, it is assumed that a call to Ngl.skewt_plt follows a call to Ngl.skewt_bkg, since the position of the plot, the title font, and so forth are inherited from the settings for Ngl.skewt_bkg.
All resource values unique to Ngl.skewt_bkg and Ngl.skewt_plt begin with "skt."
If wind speeds and directions are supplied in arguments WSPD and WDIR at places where pressures are missing, then, if geopotential values exist at those locations where pressures are missing the geopotential values are mapped (interpolated to) pressure values and the wind barbs are drawn at those pressures. These wind barbs are colored using the value of the resource sktGeopotentialWindBarbColor.
All resource values unique to Ngl.skewt_plt are reset to their defaults each time the function is called.
See Also
See the list of special "skt" resources.
Examples
For examples of using Ngl.skewt_plt, see skewt2.py (output) and skewt3.py (output).