
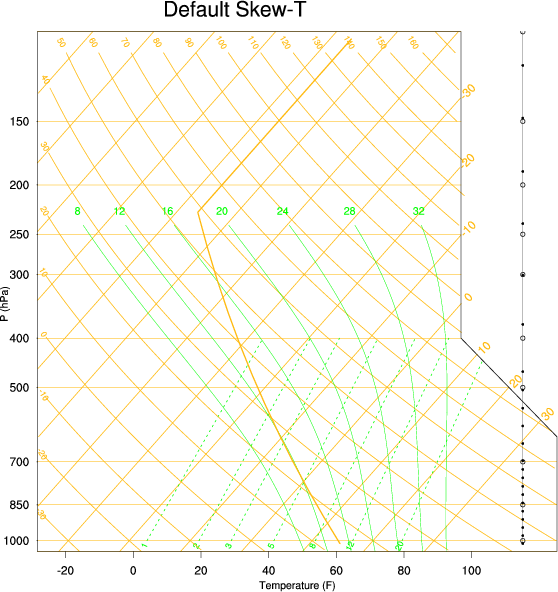
Ngl.skewt_bkg
Creates a background chart for Skew T, Log P plotting.
Prototype
sbkg = Ngl.skewt_bkg(wks, res)
Arguments
wksThe identifier returned from calling Ngl.open_wks.
resA (required) instance of the Resources class having special "skt" resources as attributes.
Return value
sbkgA PlotId of the Skew-T background chart created is returned.
Description
This function creates a chart for plotting Skew T, Log P plots using Ngl.skewt_plt. This chart is in conformance with the weather prediction chart (WPC) described in DOD-WPC 9-16-1.
The definition of a Skew T, Log P diagram, taken from a weather site on the web, is "A thermodynamic diagram, using the temperature and the logarithm of pressure as coordinates. It is used to evaluate and forecast air parcel properties. Some values that can be determined are the Convective Condensation Level (CCL), the Lifting Condensation Level (LCL), and the Level of Free Convection (LFC)."
For an overview of the information on a Skew T chart, see:
http://twister.sbs.ohio-state.edu/helpdocs/skew_T_help.html
Ngl.skewt_bkg takes a workstation ID and a resource list as arguments. By default Ngl.skewt_bkg produces no graphical output; it sets the special resources nglDraw and nglFrame to False. The primary use of Ngl.skewt_bkg is to create a background for use with Ngl.skewt_plt.
All resource values unique to Ngl.skewt_bkg (those beginning with "skt") are reset to their defaults each time the function is called. In addition to the resources beginning with "skt" the following resources are set for each call:
  Font         = "helvetica"
  tiMainString = "   "
  vpXF         = 0.07
  vpYF         = 0.925
  vpWidthF     = 0.85
  vpHeightF    = 0.85
All settings for these resources can be overridden using settings in the resource list argument.
See Also
See the list of special "skt" resources.
Examples
For an example specifically using only Ngl.skewt_bkg, see example skewt1.py (output).
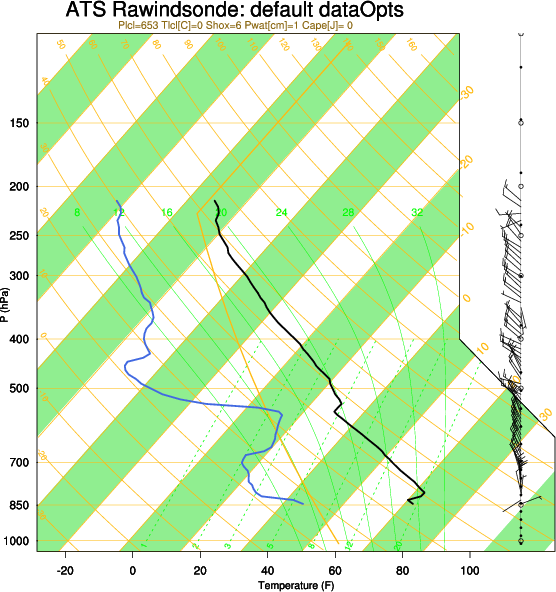
For examples of using Ngl.skewt_bkg in conjunction with Ngl.skewt_plt, see skewt2.py (output) and skewt3.py (output).
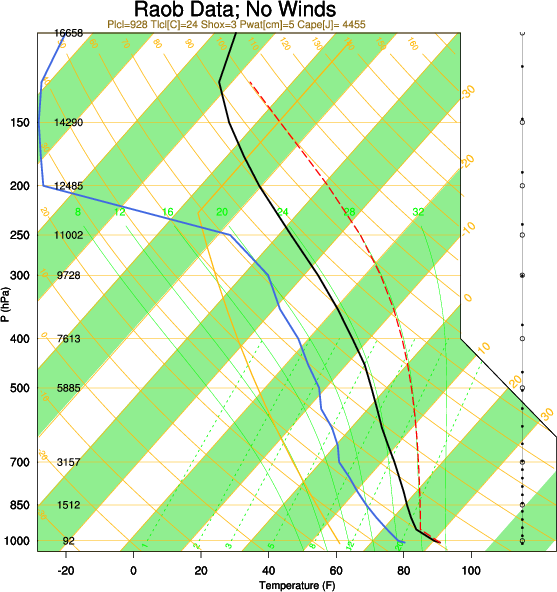