Date: Tue Aug 30 2011 - 05:31:29 MDT
Hi,
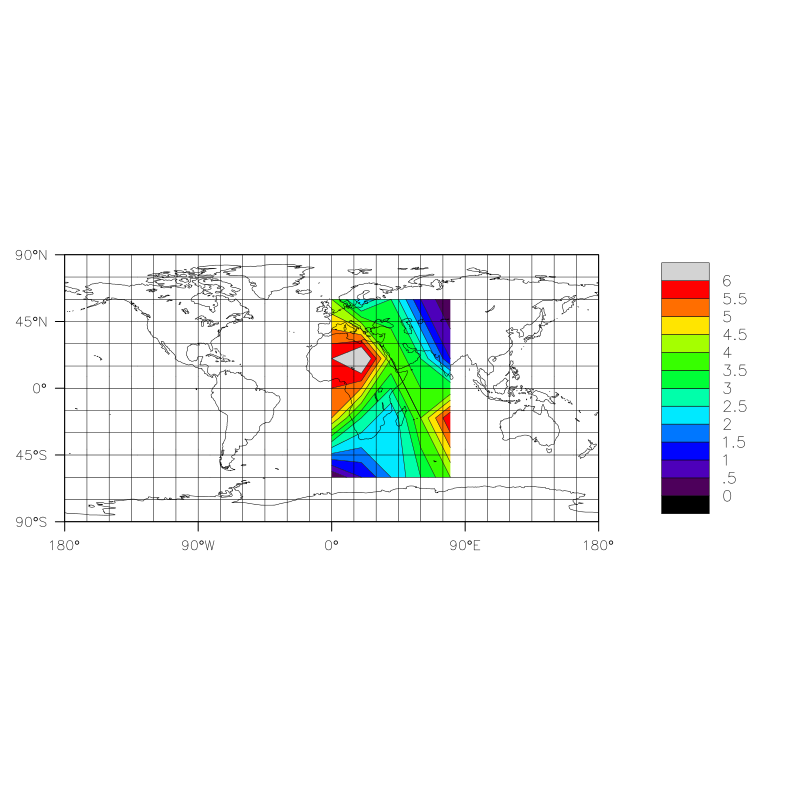
How can I control the format of the label bar labels when making a filled
contour plot? I don't like the appearance of the attached plot because it
uses '.5' and I would prefer '0.5'. I have tried using the resource
'lbLabelStrings' but it doesn't seem to do anything. I attached an example
script, which tries to change the format of the labels using this resource.
Any guidance would be appreciated,
Andrew
--
Dr Andrew Dawson
Atmospheric, Oceanic & Planetary Physics
Clarendon Laboratory
Parks Road
Oxford OX1 3PU, UK
Tel: +44 (0)1865 282438
Email: dawson@atm.ox.ac.uk
Web Site: http://www2.physics.ox.ac.uk/contacts/people/dawson
_______________________________________________
pyngl-talk mailing list
List instructions, subscriber options, unsubscribe:
http://mailman.ucar.edu/mailman/listinfo/pyngl-talk
- text/x-python attachment: lbLabelStrings_test.py