
Ngl.y
Creates and draws an XY plot using index values for the X axis.
Prototype
yplot = Ngl.y(wks, y, res=None)
Arguments
wksThe identifier returned from calling Ngl.open_wks.
yThe Y coordinates of the curve(s). y can be a one- or two-dimensional NumPy array (or masked array) or a Python list. If y is two-dimensional, then the leftmost dimension determines the number of curves and the rightmost dimension defines the number of points (npts).
res=NoneAn (optional) instance of the Resources class having PyNGL resources as attributes.
Return value
yplotA PlotId representing the XY plot created.
Description
This function creates and draws an XY plot on the given workstation and advances the frame. The Y values will be plotted against index values going from 0 to npts-1, where npts is the number of points in the curve(s). Plot options can be set via the res variable.
As of version 1.3.0, if y is a masked array, then any values equal to the fill value will not be plotted. If y is not a masked array and it contains missing values, then set the resource caYMissingV to this value.
Note that PyNGL internally sets some resources for you, depending on how other resources are set. See the list of default settings for more information.
See Also
Ngl.xy, Ngl.polyline, Ngl.polymarker, Ngl.polygon, Ngl.add_polyline, Ngl.add_polymarker, Ngl.add_polygon
XyPlot resources
Legend resources
CoordArrays resources
Title resources
TickMark resources
Transformation resources
View resources
Transform resources
PlotManager resources
Special "ngl" resources
Examples
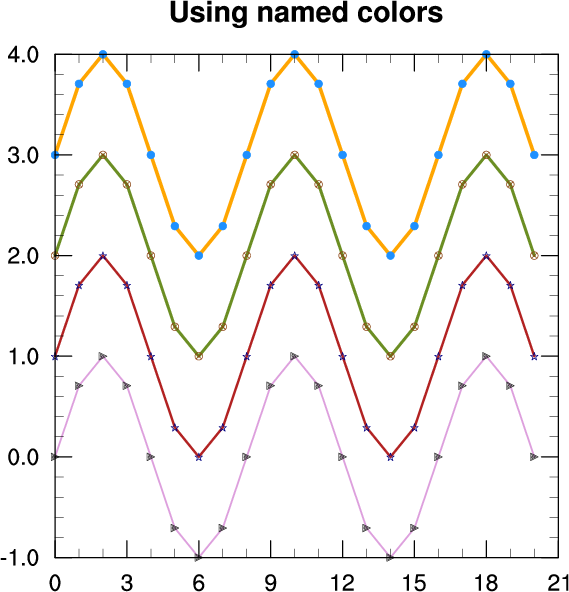
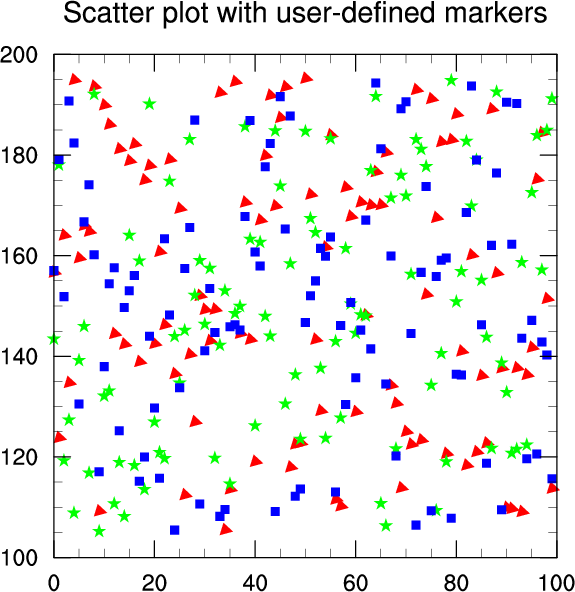
See color2.py (output) or scatter2.py (output).