
Ngl.panel
Draws multiple plots of identical size on a single frame.
Prototype
Ngl.panel(wks, plots, dims, res=None)
Arguments
wksThe identifier returned from calling Ngl.open_wks.
plotsAn array of plot identifiers, each one created by calling any of the graphics routines like Ngl.xy or Ngl.contour_map.
Each plot must be the same size in order for this procedure to work correctly.
dimsAn array of integers indicating the configuration of the plots on the frame. dims can either be two integers representing the number of rows and columns of the paneled lots, or a list of integers representing the number of plots per row.
res=NoneAn (optional) instance of the Resources class having PyNGL resources as attributes.
Return value
NoneDescription
This procedure draws multiple plots of identical size on a single frame. The plots are drawn from left to right, top to bottom. If the plots are not initially the same size, then unexpected results will occur.
The configuration of the plots on the frame are specified via the dims parameter. The default is for dims to represent the number of rows and columns of the plots. If the resource nglPanelRowSpec is set to True, then dims will represent the number of plots per row.
If any of the plots are missing, then the location where the plot would normally be will be blank.
There are many resources specific to this procedure. See the nglPanelXXXX resources. Of particular interest is nglPanelLabelBar which, if set to True, will generate a single common labelbar for all the panelled plots.
Examples
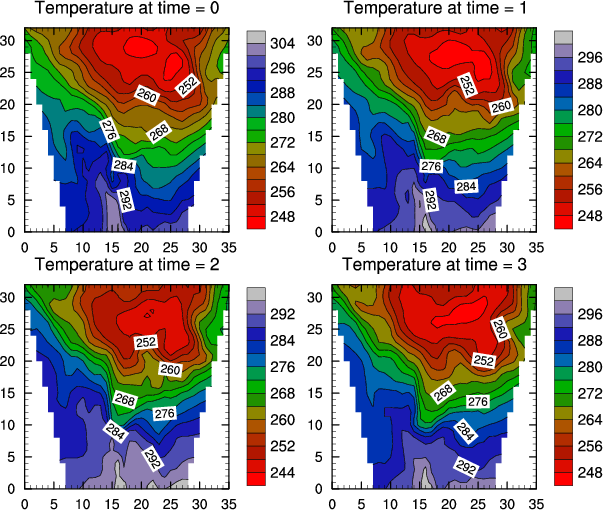
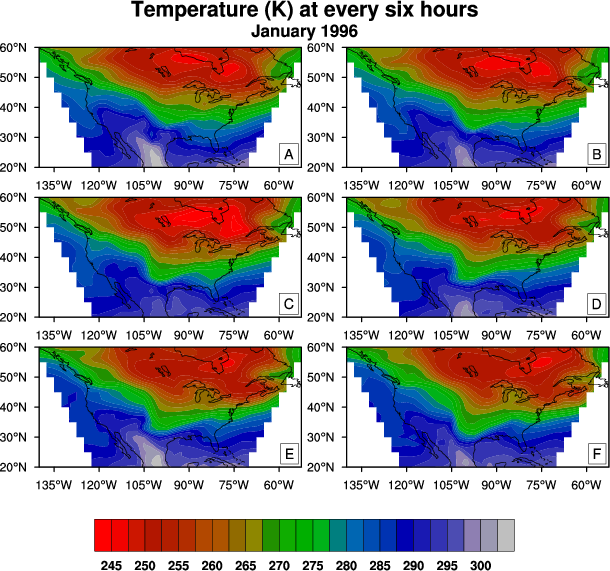
See panel1.py (4 plots, 4 plots with a common labelbar).