Date: Thu Apr 05 2012 - 12:52:08 MDT
Hello Dave,
Thanks for taking interest in my email!
Since I wrote it, I found a mistype in the code I sent you... Line
196 should be:
lon_max = lon_max + buffer # instead of lon_min + buffer
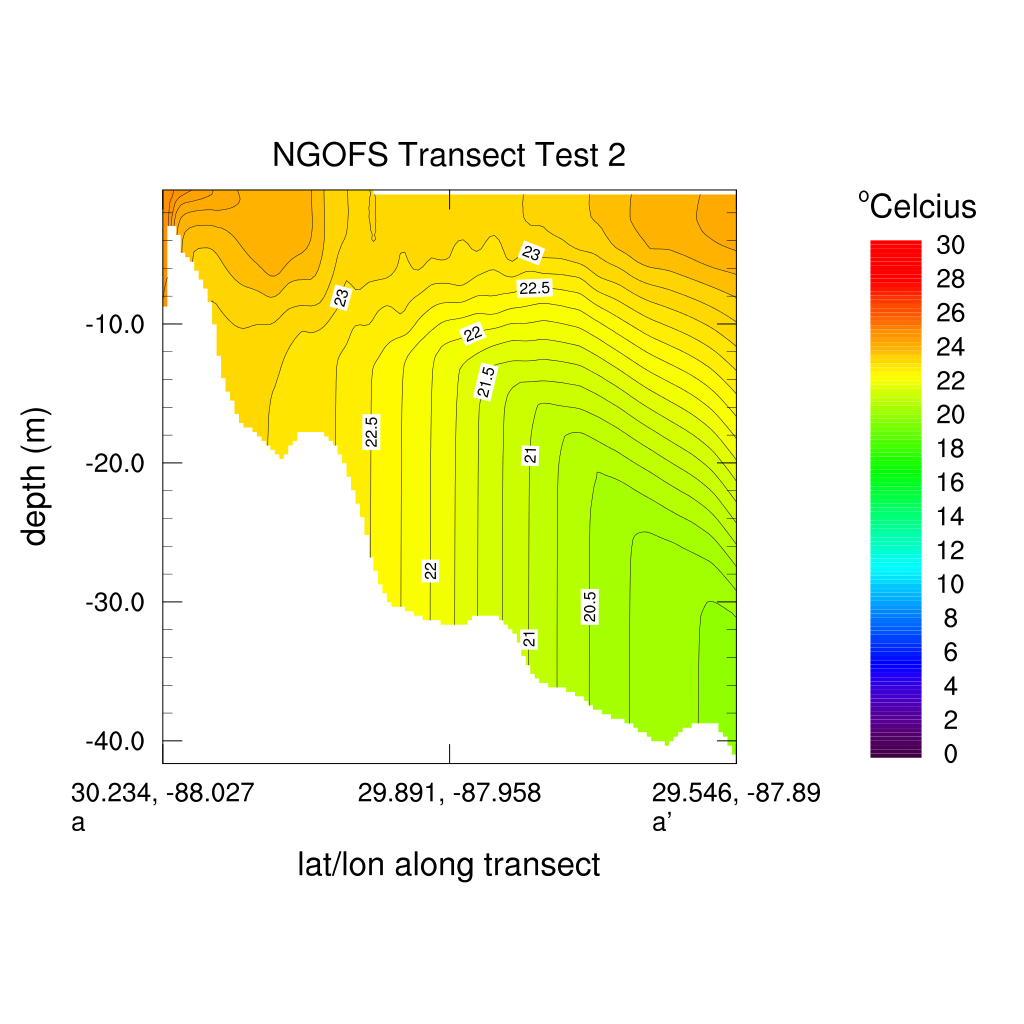
While fixing this typo does not provide a solution to the overall
problem of course, I did manage to find a way to create a transect
plot using natgrid!
My new method is:
1. Given two lat/lon coordinates, draw a transect line between them.
2. For each sigma layer, interpolate the water temperature at the
points on the transect line (using natgrid).
3. For each sigma layer, interpolate the depths at the points on the
transect line by latitude and longitude (using natgrid)
4. Find the min and max of the interpolated depths, and use them
create an array of depths at evenly spaced intervals.
5. For each depth (in the array from step 4), use the interpolated
water temperatures (from step 2) to interpolate water temperature
again (using natgrid).
6. Use the interpolated depths (from step 3) to mask out the invalid
values from step 5's interpolation.
7. Plot the result of step 6.
Not sure if that made any sense; it's kind of hard to explain at a
high level. I've attached my code and it might be easier to look at
my code to understand the algorithm. I also attached an example cross
section.
I'd still like to know if there is a more efficient way of doing this.
My solution produces nice plots, though it takes anywhere from one to
five minutes depending on my buffer size.
Anyone have any ideas for a faster way of producing a transect from a
triangular mesh?
Thanks,
Carmen
On Wed, Apr 4, 2012 at 6:59 PM, David Brown <dbrown@ucar.edu> wrote:
> Hi Carmen,
>
> This is an interesting problem (triangular-mesh in the horizontal vs layers in the vertical) that we do not have much experience with. We definitely would like to find a solution, but I don't have a ready answer. Perhaps someone on the list has a suggestion.
> Ā-dave
>
> On Mar 30, 2012, at 9:11 AM, Carmen St. Jean wrote:
>
>> Hello everyone,
>>
>> I'm attempting to use PyNGL create a transect of water temperatures in
>> the Northern Gulf of Mexico using a NetCDF file of NOAA/NOS' Northern
>> Gulf of Mexico Operational Forecast System (NGOFS). ĀHowever, the
>> contour plot seems to be bleeding into the concave boundary areas of
>> the mesh and I'm not sure how to prevent this.
>>
>> My strategy has been:
>> 1. Given two lat/lon coordinates, draw a transect line between them.
>> 2. For each sigma layer, interpolate the water temperature at the
>> points on the transect line (using natgrid).
>> 3. For each sigma layer, interpolate the depths at the points on the
>> transect line (using natgrid).
>> 4. Plot the interpolated water temperatures as a contour with the
>> interpolated depths as the y-axis and the lat/lon of the points on the
>> transect line as the x-axis.
>>
>> (Unfortunately, natgrid takes an extremely long time to run because
>> the NGOFS grid is a triangular mesh of over 90,000 nodes. ĀSo before
>> step 1, I'm drawing a bounding box around the transect line and
>> subsetting the data from the NGOFS NetCDF file to only the nodes the
>> fall within that bounding box.)
>>
>> I've played around with various resources, but nothing seems to stop
>> the contour from filling in areas erroneously when I try to plot the
>> temperature by depth (see attachment "ngofs-transect-z.png"). ĀI
>> plotted the interpolated water temperatures against sigma layer rather
>> than z (see attachment "ngofs-transect-siglay.png") and showed it to
>> an oceanographer familiar with NGOFS. He said the plot seemed to be
>> correct, so I'm confident the interpolation is working correctly.
>>
>> Are there any resources I should be setting to fix this problem? ĀOr
>> perhaps is there an easier method to creating a transect that I have
>> overlooked?
>>
>> Here is the file I'm using for input:
>> http://opendap.co-ops.nos.noaa.gov/netcdf/ngofs/201203/nos.ngofs.fields.nowcast.20120322.t03z.nc
>>
>> Thank you,
>>
>> Carmen
>> <ngofs-transect.py><ngofs-transect-siglay.png><ngofs-transect-z.png>_______________________________________________
>> pyngl-talk mailing list
>> List instructions, subscriber options, unsubscribe:
>> http://mailman.ucar.edu/mailman/listinfo/pyngl-talk
>
_______________________________________________
pyngl-talk mailing list
List instructions, subscriber options, unsubscribe:
http://mailman.ucar.edu/mailman/listinfo/pyngl-talk
- application/octet-stream attachment: ngofs-transect-fixed.py