Dear mailing list,
I'm trying to make multiple contour plots on the same page, on 2 columns and 3 rows.
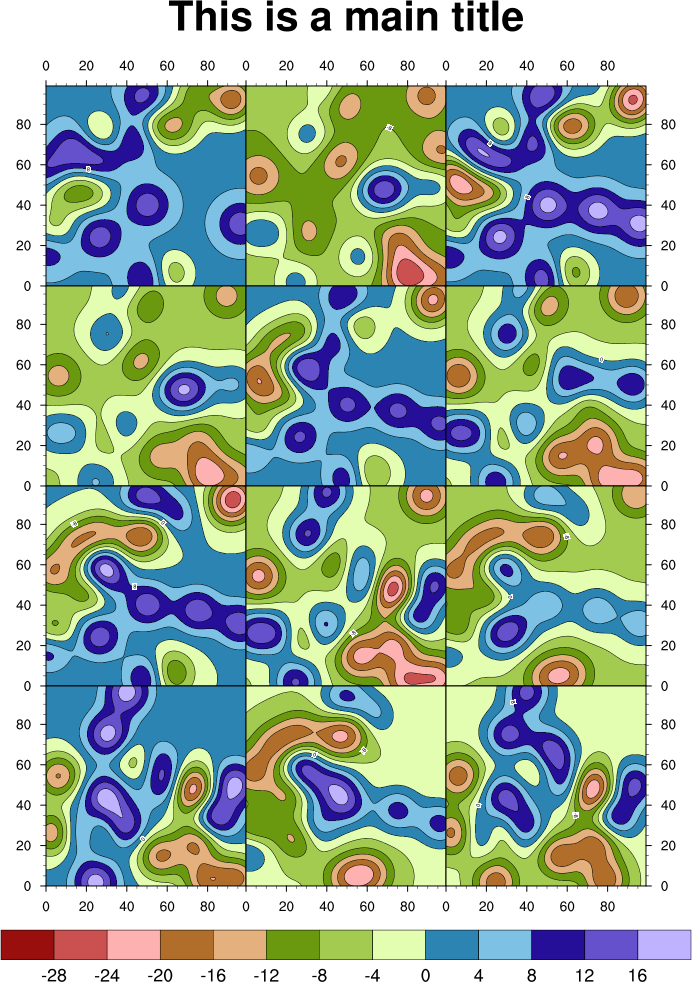
All plots are of the same size size, but I only want numbers and labels on the bottom and leftmost plots to save space.
Started of by using Ngl.panel, which took care of everything nicely except that it thinks that the numbers and labels on the axis are a part of the plots.
Hence, my plots were not considered to be of the same size and everything looked terrible.
Then I found a beautiful example on how to do this using the viewport settings instead (http://www.ncl.ucar.edu/Applications/Images/panel_23_1_lg.png).
That is, setting vpXF, vpYF for each plot.
This does not work either.
What ever vpXF,vpYF,vpHeightF,vpWidthF I set, the plots are always drawn in the center, with maximum size.
Is there some setting I have missed here?
I have tried copying this script as far as possible:
http://www.ncl.ucar.edu/Applications/Scripts/panel_23.ncl
Here is my script (a bit messy, as I try different things all the time).
Thanks for any help!
/Joakim
-----------------------------------------------
Joakim Kjellsson
PhD student
Department of Meteorology (MISU)
Stockholm University
Mail address:
Svante Arrhenius väg 16C
106 91 Stockholm, SWEDEN
Phone: +46-8-162404
------------------------------------------------
_______________________________________________
pyngl-talk mailing list
List instructions, subscriber options, unsubscribe:
http://mailman.ucar.edu/mailman/listinfo/pyngl-talk
This archive was generated by hypermail 2.1.8 : Wed Jan 04 2012 - 10:54:01 MST