Date: Thu Nov 04 2010 - 07:38:28 MDT
Hi Mary, Dave and everyone,
(I'm not really sure if my previous mail made it as it was a little too
big with the original eps attachments. So there it is again with pngs
instead.)
we recently stumbled upon a bug in Ngl.contour_map that happens when
there is a constant field value left of 0 degrees longitude on the map.
The plot will simply be white/transparent on the whole left side then.
As soon as one different value appears in that field, everything works
as expected. This only happens left of 0 degrees. If 0 is shifted
completely to the left side of the map, then the constant area is
displayed just fine (then on the right side).
I'm probably not very good at explaining that, so I attached a simple
demo script and three output files generated by it (originally eps,
converted to png for size).
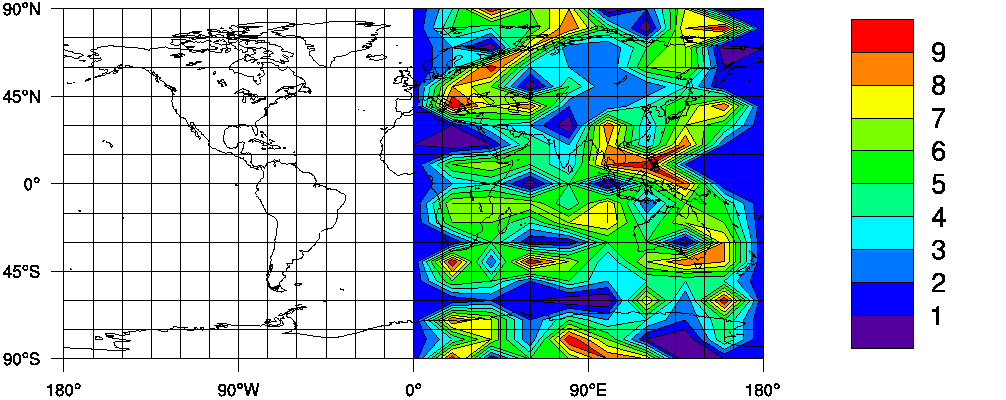
test.png: 0 degrees in the middle of the map, constant field on the left
is all white
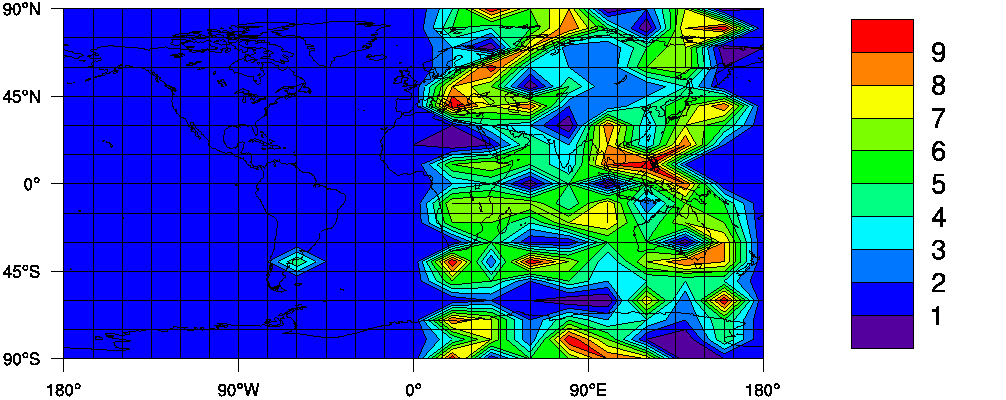
test2.png: left side contains one other value and it works like it should
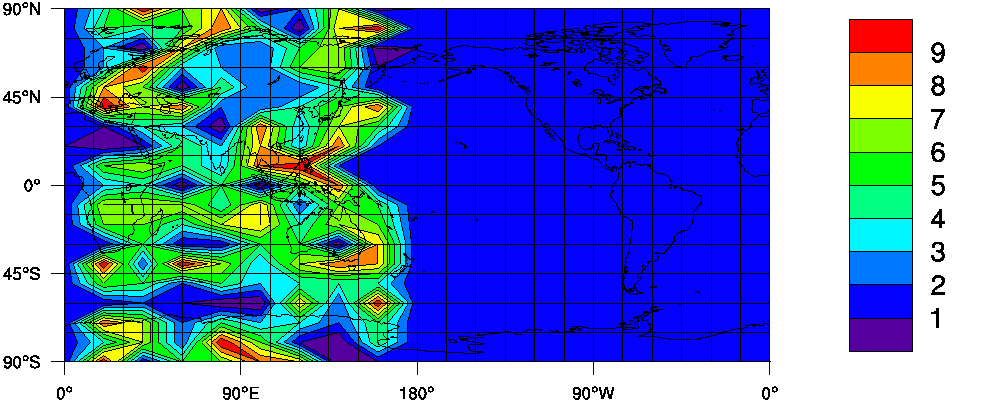
test3.png: 0 degrees shifted to the left of map, same data as for
test.png but like this it works just fine
Cheers,
Michael
--
Michael Decker
Forschungszentrum Jülich
Institut für Energie- und Klimaforschung - Troposphäre (IEK-8)
E-Mail: m.decker@fz-juelich.de
_______________________________________________
pyngl-talk mailing list
List instructions, subscriber options, unsubscribe:
http://mailman.ucar.edu/mailman/listinfo/pyngl-talk
- text/x-python attachment: pyngl_error.py
- application/pkcs7-signature attachment: S/MIME Cryptographic Signature