Date: Thu Aug 12 2010 - 11:16:54 MDT
Hi Peter,
I don't know the internals of how the PNG sizing works, but I do know that PyNGL wants to draw to a square, and
hence it will not skew the image if you set a size of 2500 x 1000.
These resources are working, but I believe what happens is that you get an actual image that is the smaller
of the two sizes, and hence 1000 x 1000.
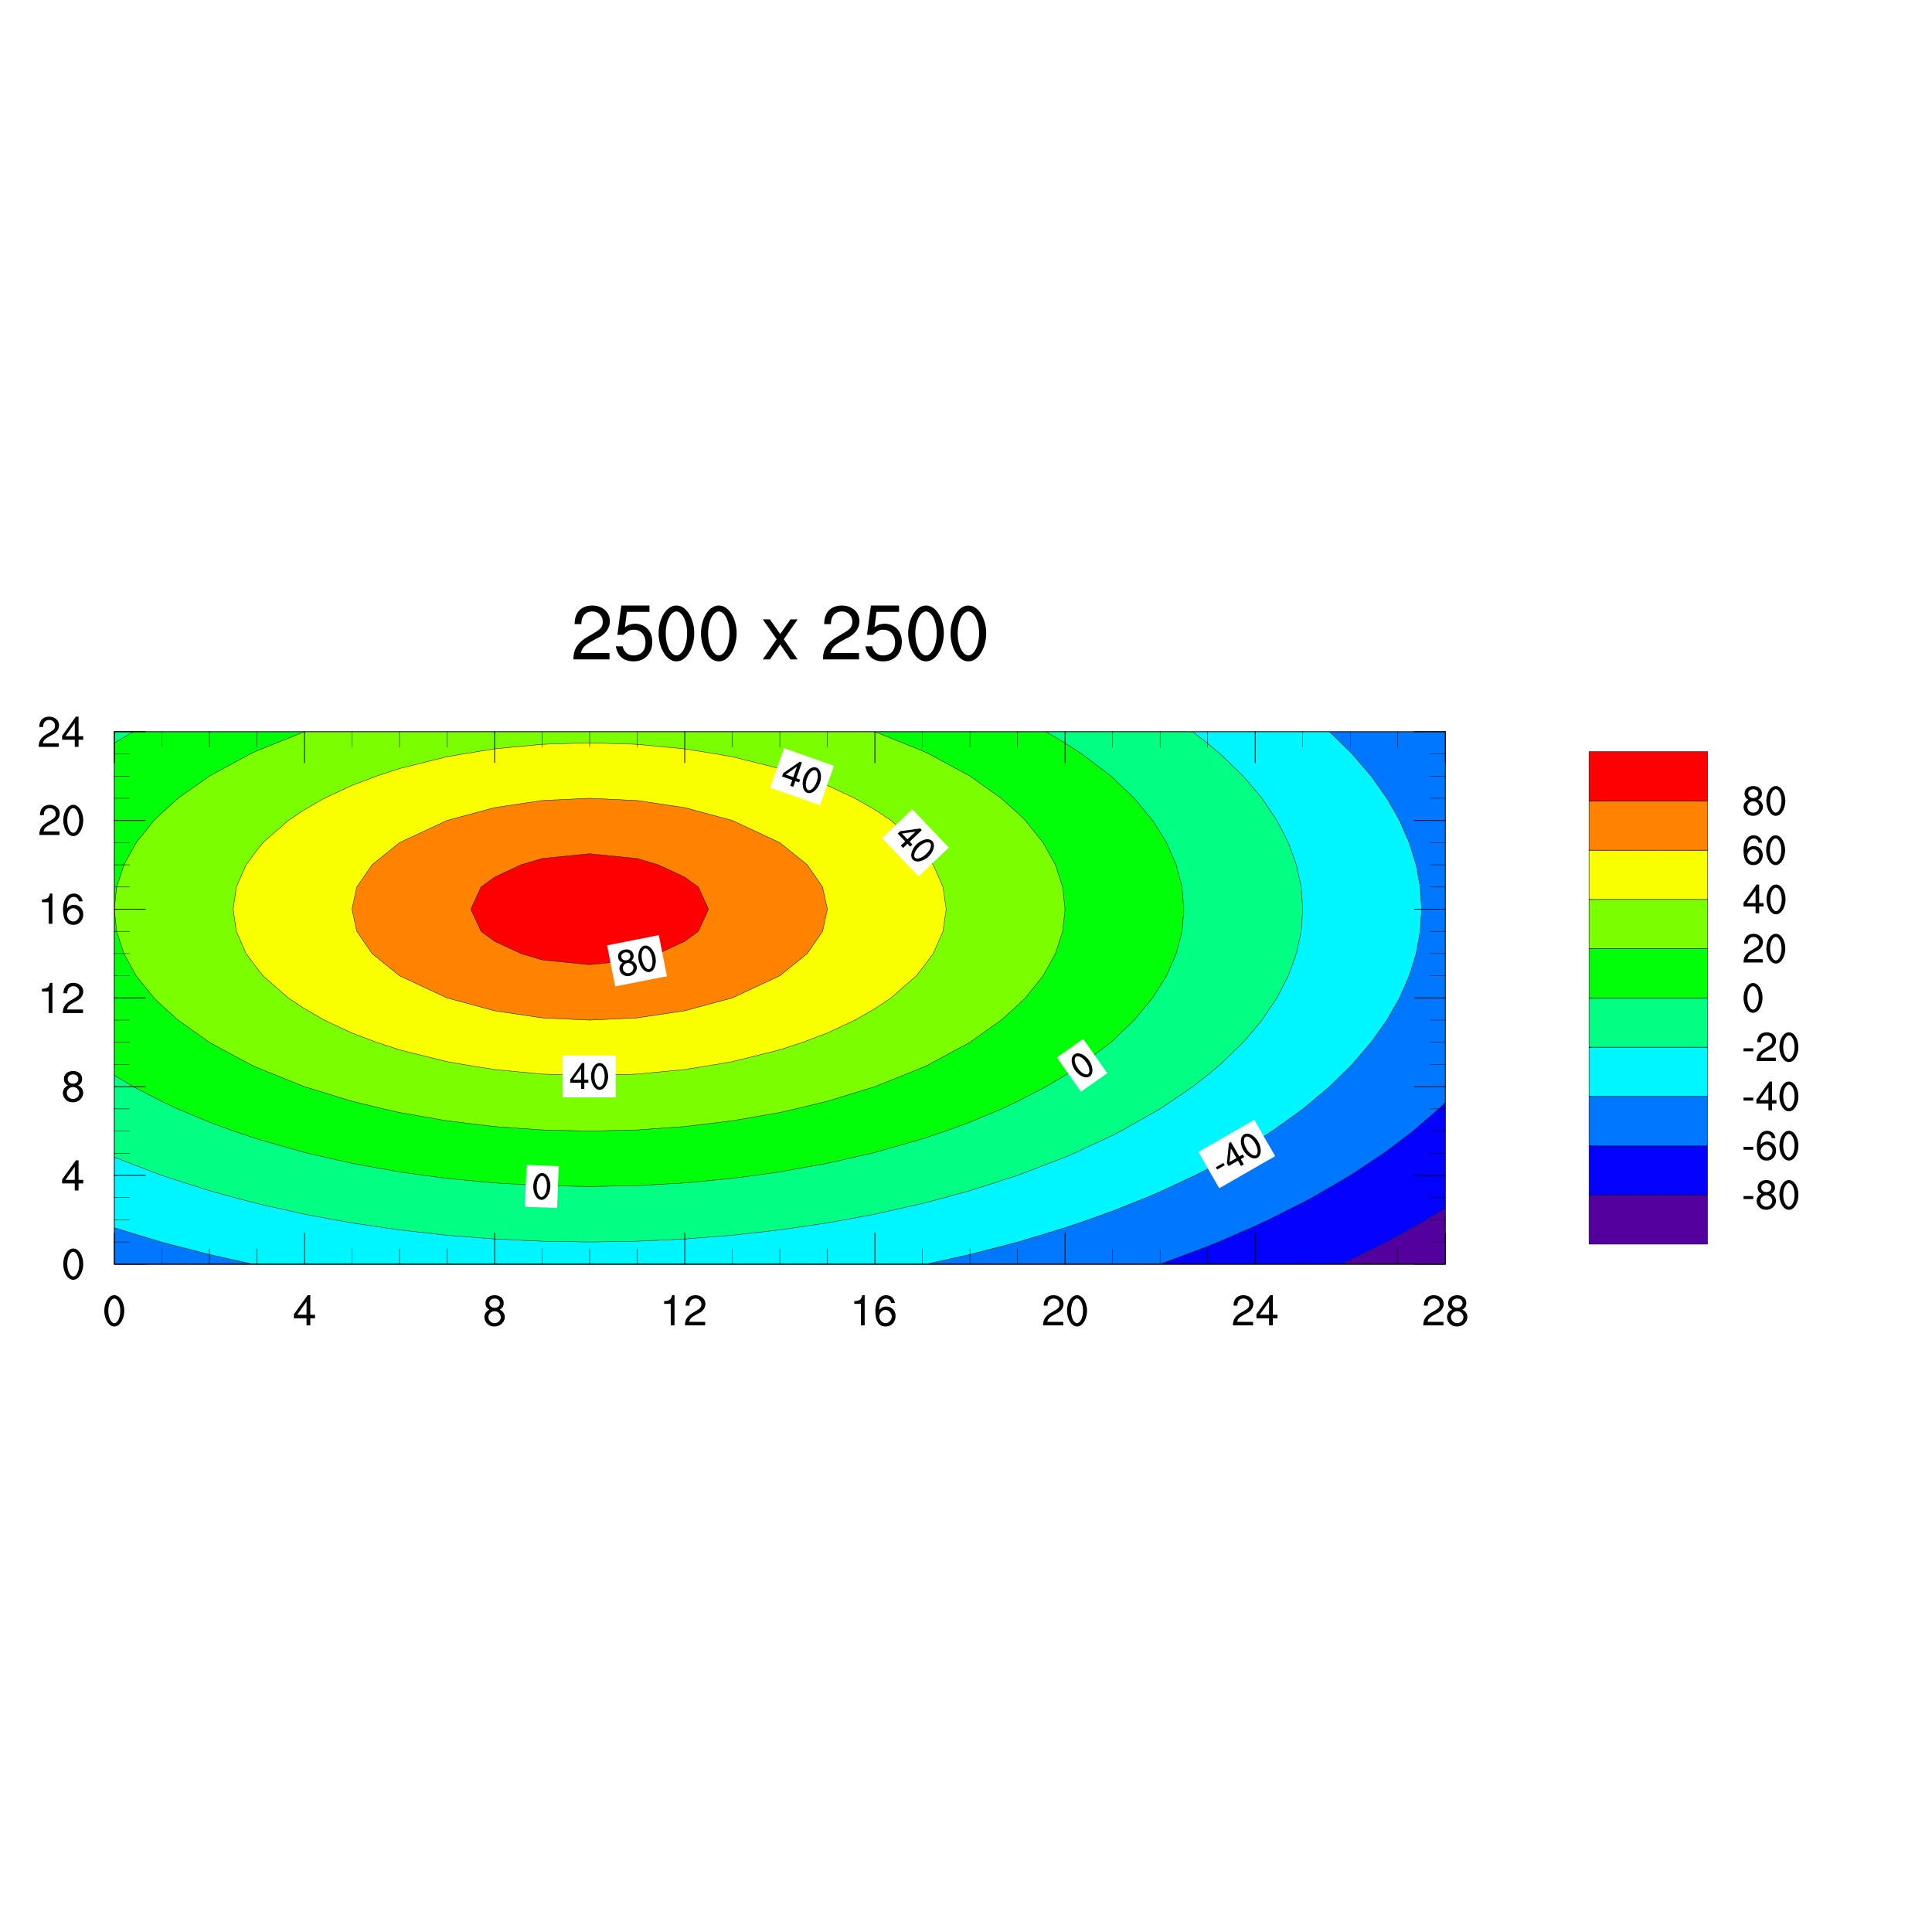
If you actually need to skew the shape of the plot and have it drawn to a 2500 x 1000 area, then what I
recommend is setting the vpWidthF and vpHeightF resources to define the shape of your plot,
and then draw to a 2500 x 2500 square area.
See the attached cn02p.py script and image.
Let me know if this doesn't help.
--Mary
On Aug 11, 2010, at 10:55 AM, Lean, Peter (3246-CalTech) wrote:
> Hi,
>
> I'm new to PyNGL so this is probably a simple question, but I'm struggling a bit with it.
>
> I'm making a contour map png image and need to change the default image size.
> I've used wkWidth and wkHeight to change the image size (which works fine), but the actual contour plot is still the original size (or at least does not fill the entire image). How can I increase the plot size to fill the png image? (NB. I've used nglMaximize, but it didn't seem to have any effect).
>
> My code is below.
>
> Any help is much appreciated!
>
> Thanks,
>
> Peter
>
> --
>
>
> wks_type = "png"
> res = Ngl.Resources()
> res.wkWidth = 2500
> res.wkHeight = 1000
> wks = Ngl.open_wks(wks_type,'test',res)
>
> resources = Ngl.Resources()
> resources.nglMaximize = True # didn't seem to have any effect
>
> # Define data lat,lon limits
> resources.cnFillOn = True # Turn on contour fill.
> resources.sfXCStartV = float(min(lons))
> resources.sfXCEndV = float(max(lons))
> resources.sfYCStartV = float(min(lats))
> resources.sfYCEndV = float(max(lats))
>
> # Define map lat,lon limits
> resources.mpLimitMode = "LatLon" # Limit the map view.
> resources.mpMinLonF = float(min(lons))
> resources.mpMaxLonF = float(max(lons))
> resources.mpMinLatF = float(min(lats))
> resources.mpMaxLatF = float(max(lats))
> resources.mpPerimOn = True # Turn on map perimeter.
>
> # Set up the contour levels
> resources.cnLevelSelectionMode = "ExplicitLevels" # Define own levels.
> nsteps=7
> resources.cnLevels = numpy.arange(data.min(),data.max(),(data.max()-data.min())/nsteps)
>
> map = Ngl.contour_map(wks,data,resources)
>
>
> _______________________________________________
> pyngl-talk mailing list
> List instructions, subscriber options, unsubscribe:
> http://mailman.ucar.edu/mailman/listinfo/pyngl-talk
_______________________________________________
pyngl-talk mailing list
List instructions, subscriber options, unsubscribe:
http://mailman.ucar.edu/mailman/listinfo/pyngl-talk
- text/x-python-script attachment: cn02p.py